C++ Example
Application Level Example:
 1 #include <dftracer/dftracer.h>
 2
 3 void foo() {
 4   DFTRACER_CPP_FUNCTION(); // Add at the begining of each function
 5   sleep(1);
 6   {
 7     DFTRACER_CPP_REGION(CUSTOM); // Add at the beginning of code block. keep name unique
 8     sleep(1);
 9     DFTRACER_CPP_REGION_START(CUSTOM_BLOCK); // add start. keep name unique
10     sleep(1);
11     DFTRACER_CPP_REGION_END(CUSTOM_BLOCK); // add end. Match name from START.
12   }
13 }
14
15 int main(int argc, char *argv[]) {
16   // Basic Bookkeeping
17   int init = 0;
18   if (argc > 2) {
19     if (strcmp(argv[2], "1") == 0) {
20       // Initialize Application Profiler
21       DFTRACER_CPP_INIT(nullptr, nullptr, nullptr);
22       init = 1;
23     }
24   }
25   char filename[1024];
26   sprintf(filename, "%s/demofile.txt", argv[1]);
27
28   // Run functions
29   foo();
30   // Implicit I/O calls No need for marking.
31   FILE *fh = fopen(filename, "w+");
32   if (fh != NULL) {
33     fwrite("hello", sizeof("hello"), 1, fh);
34     fclose(fh);
35   }
36   if (init == 1) {
37     // Finalize Application Profiler
38     DFTRACER_CPP_FINI();
39   }
40   return 0;
41 }
For this example, link with libdftracer.so at compile time.
As the DFTRACER_CPP_INIT do not pass log file or data dir, we need to set DFTRACER_LOG_FILE and DFTRACER_DATA_DIR.
By default the DFTracer mode is set to FUNCTION.
Example of running this configurations are:
1 # the process id, app_name and .pfw will be appended by the profiler for each app and process.
2 # name of final log file is ~/log_file-<APP_NAME>-<PID>.pfw
3 DFTRACER_LOG_FILE=~/log_file
4 # Colon separated paths for including for profiler
5 DFTRACER_DATA_DIR=/dev/shm/:/p/gpfs1/$USER/dataset
6 # Enable profiler
7 DFTRACER_ENABLE=1
Warning
Note: DFTRACER_DATA_DIR uses a prefix tree. If both /local/scratch and
/local/scratch/data are in the list, the order matters—
the last one will override the first. As a result, the first path won’t be traced.
To avoid this, only use /local/scratch.
LD_PRELOAD Example:
 1 #include <dftracer/dftracer.h>
 2
 3 int main(int argc, char *argv[]) {
 4   char filename[1024];
 5   sprintf(filename, "%s/demofile.txt", argv[1]);
 6   foo(); # function will be ignored in pure LD_PRELOAD mode.
 7   // Implicit I/O calls No need for marking.
 8   FILE *fh = fopen(filename, "w+");
 9   if (fh != NULL) {
10     fwrite("hello", sizeof("hello"), 1, fh);
11     fclose(fh);
12   }
13   return 0;
14 }
For this example, LD_PRELOAD the executable with libdftracer_preload.so at runtime.
We need to set DFTRACER_LOG_FILE and DFTRACER_DATA_DIR.
Example of running this configurations are:
1 # the process id, app_name and .pfw will be appended by the profiler for each app and process.
2 # name of final log file is ~/log_file-<APP_NAME>-<PID>.pfw
3 export DFTRACER_LOG_FILE=~/log_file
4 # Colon separated paths for including for profiler
5 export DFTRACER_DATA_DIR=/dev/shm/:/p/gpfs1/$USER/dataset
6 # Set the mode to PRELOAD
7 export DFTRACER_INIT=PRELOAD
8 # Enable profiler
9 export DFTRACER_ENABLE=1
Hybrid Example:
 1 #include <dftracer/dftracer.h>
 2
 3 void foo() {
 4   DFTRACER_CPP_FUNCTION(); // Add at the begining of each function
 5   sleep(1);
 6   {
 7     DFTRACER_CPP_REGION(CUSTOM); // Add at the beginning of code block. keep name unique
 8     sleep(1);
 9     DFTRACER_CPP_REGION_START(CUSTOM_BLOCK); // add start. keep name unique
10     sleep(1);
11     DFTRACER_CPP_REGION_END(CUSTOM_BLOCK); // add end. Match name from START.
12   }
13 }
14
15 int main(int argc, char *argv[]) {
16   // Basic Bookkeeping
17   int init = 0;
18   if (argc > 2) {
19     if (strcmp(argv[2], "1") == 0) {
20       // Initialize Application Profiler
21       DFTRACER_CPP_INIT(nullptr, nullptr, nullptr);
22       init = 1;
23     }
24   }
25   char filename[1024];
26   sprintf(filename, "%s/demofile.txt", argv[1]);
27
28   // Run functions
29   foo();
30   // Implicit I/O calls No need for marking.
31   FILE *fh = fopen(filename, "w+");
32   if (fh != NULL) {
33     fwrite("hello", sizeof("hello"), 1, fh);
34     fclose(fh);
35   }
36   if (init == 1) {
37     // Finalize Application Profiler
38     DFTRACER_CPP_FINI();
39   }
40   return 0;
41 }
For this example, link with libdftracer.so at compile time and LD_PRELOAD the executable with libdftracer_preload.soat runtime.
As the DFTRACER_CPP_INIT do not pass log file or data dir, we need to set DFTRACER_LOG_FILE and DFTRACER_DATA_DIR.
By default the DFTracer mode is set to FUNCTION.
Example of running this configurations are:
1 # the process id, app_name and .pfw will be appended by the profiler for each app and process.
2 # name of final log file is ~/log_file-<APP_NAME>-<PID>.pfw
3 DFTRACER_LOG_FILE=~/log_file
4 # Colon separated paths for including for profiler
5 DFTRACER_DATA_DIR=/dev/shm/:/p/gpfs1/$USER/dataset
6 # Set the mode to PRELOAD
7 export DFTRACER_INIT=PRELOAD
8 # Enable profiler
9 DFTRACER_ENABLE=1
C Example
Application Level Example:
 1 #include <dftracer/dftracer.h>
 2
 3 void foo() {
 4   DFTRACER_C_FUNCTION_START();
 5   sleep(1);
 6   if (<CONDITION>) {
 7     DFTRACER_C_FUNCTION_END();
 8     return; // Define DFTRACER_C_FUNCTION_END on every branch
 9   }
10   {
11     DFTRACER_C_REGION_START(CUSTOM);
12     sleep(1);
13     DFTRACER_C_REGION_END(CUSTOM); // END region CUSTOM.
14   }
15   DFTRACER_C_FUNCTION_END(); // Define DFTRACER_C_FUNCTION_END on every branch
16 }
17
18 int main(int argc, char *argv[]) {
19   // Basic Bookkeeping
20   int init = 0;
21   if (argc > 2) {
22     if (strcmp(argv[2], "1") == 0) {
23       // Initialize Application Profiler
24       DFTRACER_C_INIT(nullptr, nullptr, nullptr);
25       init = 1;
26     }
27   }
28   char filename[1024];
29   sprintf(filename, "%s/demofile.txt", argv[1]);
30
31   // Run functions
32   foo();
33   // Implicit I/O calls No need for marking.
34   FILE *fh = fopen(filename, "w+");
35   if (fh != NULL) {
36     fwrite("hello", sizeof("hello"), 1, fh);
37     fclose(fh);
38   }
39   if (init == 1) {
40     // Finalize Application Profiler
41     DFTRACER_C_FINI();
42   }
43   return 0;
44 }
For this example, link with libdftracer.so at compile time.
As the DFTRACER_CPP_INIT do not pass log file or data dir, we need to set DFTRACER_LOG_FILE and DFTRACER_DATA_DIR.
By default the DFTracer mode is set to FUNCTION.
Example of running this configurations are:
1 # the process id, app_name and .pfw will be appended by the profiler for each app and process.
2 # name of final log file is ~/log_file-<APP_NAME>-<PID>.pfw
3 DFTRACER_LOG_FILE=~/log_file
4 # Colon separated paths for including for profiler
5 DFTRACER_DATA_DIR=/dev/shm/:/p/gpfs1/$USER/dataset
6 # Enable profiler
7 DFTRACER_ENABLE=1
LD_PRELOAD Example:
 1 #include <dftracer/dftracer.h>
 2
 3 int main(int argc, char *argv[]) {
 4   char filename[1024];
 5   sprintf(filename, "%s/demofile.txt", argv[1]);
 6   foo(); # function will be ignored in pure LD_PRELOAD mode.
 7   // Implicit I/O calls No need for marking.
 8   FILE *fh = fopen(filename, "w+");
 9   if (fh != NULL) {
10     fwrite("hello", sizeof("hello"), 1, fh);
11     fclose(fh);
12   }
13   return 0;
14 }
For this example, LD_PRELOAD the executable with libdftracer_preload.so at runtime.
We need to set DFTRACER_LOG_FILE and DFTRACER_DATA_DIR.
Example of running this configurations are:
1 # the process id, app_name and .pfw will be appended by the profiler for each app and process.
2 # name of final log file is ~/log_file-<APP_NAME>-<PID>.pfw
3 export DFTRACER_LOG_FILE=~/log_file
4 # Colon separated paths for including for profiler
5 export DFTRACER_DATA_DIR=/dev/shm/:/p/gpfs1/$USER/dataset
6 # Set the mode to PRELOAD
7 export DFTRACER_INIT=PRELOAD
8 # Enable profiler
9 export DFTRACER_ENABLE=1
Hybrid Example:
 1 #include <dftracer/dftracer.h>
 2
 3 void foo() {
 4   DFTRACER_C_FUNCTION_START();
 5   sleep(1);
 6   if (<CONDITION>) {
 7     DFTRACER_C_FUNCTION_END();
 8     return; // Define DFTRACER_C_FUNCTION_END on every branch
 9   }
10   {
11     DFTRACER_C_REGION_START(CUSTOM);
12     sleep(1);
13     DFTRACER_C_REGION_END(CUSTOM); // END region CUSTOM.
14   }
15   DFTRACER_C_FUNCTION_END(); // Define DFTRACER_C_FUNCTION_END on every branch
16 }
17
18 int main(int argc, char *argv[]) {
19   // Basic Bookkeeping
20   int init = 0;
21   if (argc > 2) {
22     if (strcmp(argv[2], "1") == 0) {
23       // Initialize Application Profiler
24       DFTRACER_C_INIT(nullptr, nullptr, nullptr);
25       init = 1;
26     }
27   }
28   char filename[1024];
29   sprintf(filename, "%s/demofile.txt", argv[1]);
30
31   // Run functions
32   foo();
33   // Implicit I/O calls No need for marking.
34   FILE *fh = fopen(filename, "w+");
35   if (fh != NULL) {
36     fwrite("hello", sizeof("hello"), 1, fh);
37     fclose(fh);
38   }
39   if (init == 1) {
40     // Finalize Application Profiler
41     DFTRACER_C_FINI();
42   }
43   return 0;
44 }
For this example, link with libdftracer.so at compile time and LD_PRELOAD the executable with libdftracer_preload.so at runtime.
As the DFTRACER_CPP_INIT do not pass log file or data dir, we need to set DFTRACER_LOG_FILE and DFTRACER_DATA_DIR.
By default the DFTracer mode is set to FUNCTION.
Example of running this configurations are:
1 # the process id, app_name and .pfw will be appended by the profiler for each app and process.
2 # name of final log file is ~/log_file-<APP_NAME>-<PID>.pfw
3 DFTRACER_LOG_FILE=~/log_file
4 # Colon separated paths for including for profiler
5 DFTRACER_DATA_DIR=/dev/shm/:/p/gpfs1/$USER/dataset
6 # Set the mode to PRELOAD
7 export DFTRACER_INIT=PRELOAD
8 # Enable profiler
9 DFTRACER_ENABLE=1
Python Example
For more detailed information about using DFTracer Python logging features, please refer to the python dftracer documentation.
Integrated Applications
Here is the list applications that currently use DFTracer.
MuMMI
Resnet50 with pytorch and torchvision
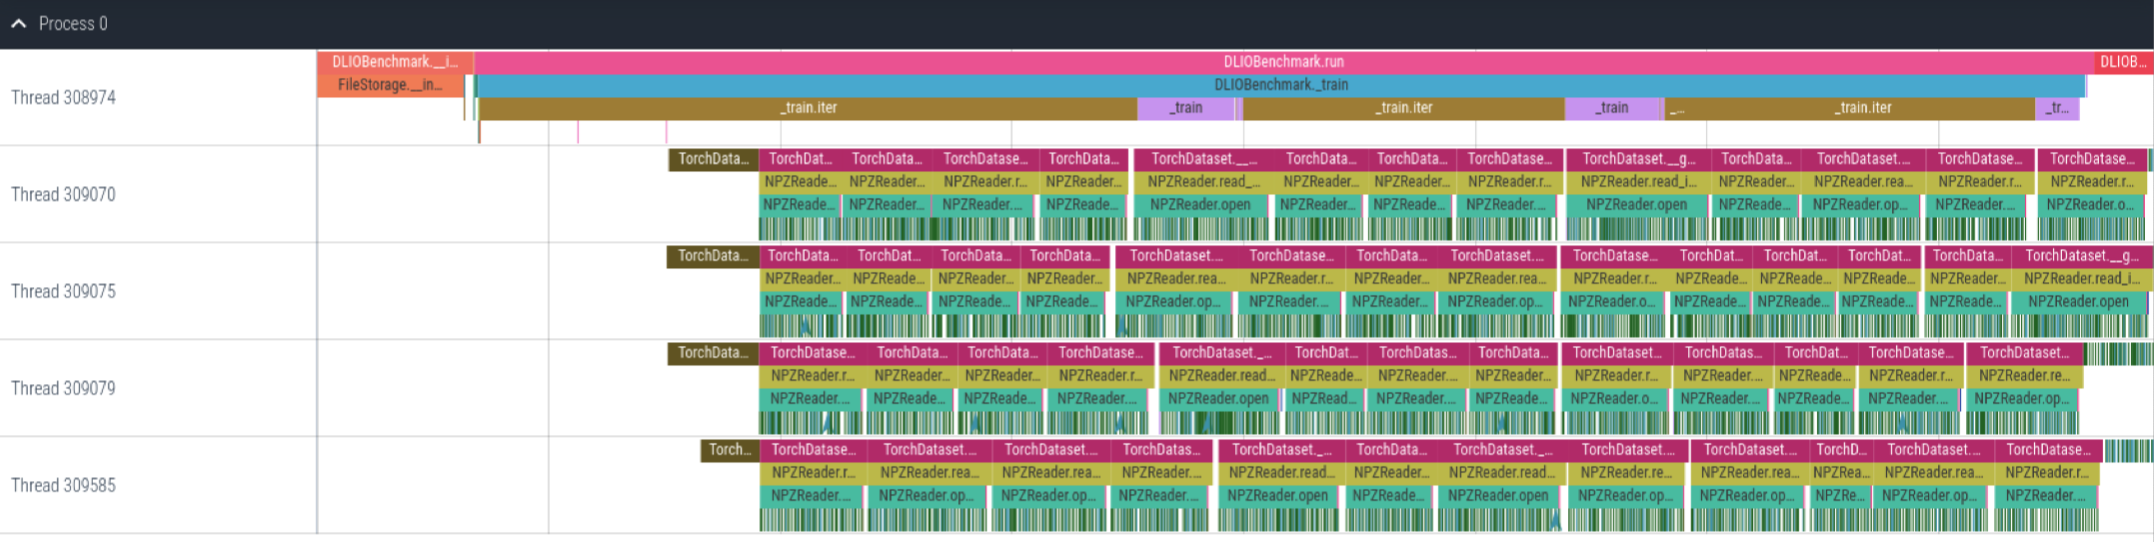
Example Chrome Tracing Plots
Example of Unet3D application with DLIO Benchmark. This trace shows the first few steps of the benchmark.
Here, we can see that we can get application level calls (e.g., train and TorchDataset) as well as low-level I/O calls (dark green color).