C++ Example
Application Level Example:
 1 #include <dftracer/dftracer.h>
 2
 3 void foo() {
 4   DFTRACER_CPP_FUNCTION(); // Add at the begining of each function
 5   sleep(1);
 6   {
 7     DFTRACER_CPP_REGION(CUSTOM); // Add at the beginning of code block. keep name unique
 8     sleep(1);
 9     DFTRACER_CPP_REGION_START(CUSTOM_BLOCK); // add start. keep name unique
10     sleep(1);
11     DFTRACER_CPP_REGION_END(CUSTOM_BLOCK); // add end. Match name from START.
12   }
13 }
14
15 int main(int argc, char *argv[]) {
16   // Basic Bookkeeping
17   int init = 0;
18   if (argc > 2) {
19     if (strcmp(argv[2], "1") == 0) {
20       // Initialize Application Profiler
21       DFTRACER_CPP_INIT(nullptr, nullptr, nullptr);
22       init = 1;
23     }
24   }
25   char filename[1024];
26   sprintf(filename, "%s/demofile.txt", argv[1]);
27
28   // Run functions
29   foo();
30   // Implicit I/O calls No need for marking.
31   FILE *fh = fopen(filename, "w+");
32   if (fh != NULL) {
33     fwrite("hello", sizeof("hello"), 1, fh);
34     fclose(fh);
35   }
36   if (init == 1) {
37     // Finalize Application Profiler
38     DFTRACER_CPP_FINI();
39   }
40   return 0;
41 }
For this example, link with libdftracer.so at compile time.
As the DFTRACER_CPP_INIT do not pass log file or data dir, we need to set DFTRACER_LOG_FILE and DFTRACER_DATA_DIR.
By default the DFTracer mode is set to FUNCTION.
Example of running this configurations are:
1 # the process id, app_name and .pfw will be appended by the profiler for each app and process.
2 # name of final log file is ~/log_file-<APP_NAME>-<PID>.pfw
3 DFTRACER_LOG_FILE=~/log_file
4 # Colon separated paths for including for profiler
5 DFTRACER_DATA_DIR=/dev/shm/:/p/gpfs1/$USER/dataset
6 # Enable profiler
7 DFTRACER_ENABLE=1
Warning
Note: DFTRACER_DATA_DIR uses a prefix tree. If both /local/scratch and
/local/scratch/data are in the list, the order matters—
the last one will override the first. As a result, the first path won’t be traced.
To avoid this, only use /local/scratch.
LD_PRELOAD Example:
 1 #include <dftracer/dftracer.h>
 2
 3 int main(int argc, char *argv[]) {
 4   char filename[1024];
 5   sprintf(filename, "%s/demofile.txt", argv[1]);
 6   foo(); # function will be ignored in pure LD_PRELOAD mode.
 7   // Implicit I/O calls No need for marking.
 8   FILE *fh = fopen(filename, "w+");
 9   if (fh != NULL) {
10     fwrite("hello", sizeof("hello"), 1, fh);
11     fclose(fh);
12   }
13   return 0;
14 }
For this example, LD_PRELOAD the executable with libdftracer_preload.so at runtime.
We need to set DFTRACER_LOG_FILE and DFTRACER_DATA_DIR.
Example of running this configurations are:
1 # the process id, app_name and .pfw will be appended by the profiler for each app and process.
2 # name of final log file is ~/log_file-<APP_NAME>-<PID>.pfw
3 export DFTRACER_LOG_FILE=~/log_file
4 # Colon separated paths for including for profiler
5 export DFTRACER_DATA_DIR=/dev/shm/:/p/gpfs1/$USER/dataset
6 # Set the mode to PRELOAD
7 export DFTRACER_INIT=PRELOAD
8 # Enable profiler
9 export DFTRACER_ENABLE=1
Hybrid Example:
 1 #include <dftracer/dftracer.h>
 2
 3 void foo() {
 4   DFTRACER_CPP_FUNCTION(); // Add at the begining of each function
 5   sleep(1);
 6   {
 7     DFTRACER_CPP_REGION(CUSTOM); // Add at the beginning of code block. keep name unique
 8     sleep(1);
 9     DFTRACER_CPP_REGION_START(CUSTOM_BLOCK); // add start. keep name unique
10     sleep(1);
11     DFTRACER_CPP_REGION_END(CUSTOM_BLOCK); // add end. Match name from START.
12   }
13 }
14
15 int main(int argc, char *argv[]) {
16   // Basic Bookkeeping
17   int init = 0;
18   if (argc > 2) {
19     if (strcmp(argv[2], "1") == 0) {
20       // Initialize Application Profiler
21       DFTRACER_CPP_INIT(nullptr, nullptr, nullptr);
22       init = 1;
23     }
24   }
25   char filename[1024];
26   sprintf(filename, "%s/demofile.txt", argv[1]);
27
28   // Run functions
29   foo();
30   // Implicit I/O calls No need for marking.
31   FILE *fh = fopen(filename, "w+");
32   if (fh != NULL) {
33     fwrite("hello", sizeof("hello"), 1, fh);
34     fclose(fh);
35   }
36   if (init == 1) {
37     // Finalize Application Profiler
38     DFTRACER_CPP_FINI();
39   }
40   return 0;
41 }
For this example, link with libdftracer.so at compile time and LD_PRELOAD the executable with libdftracer_preload.soat runtime.
As the DFTRACER_CPP_INIT do not pass log file or data dir, we need to set DFTRACER_LOG_FILE and DFTRACER_DATA_DIR.
By default the DFTracer mode is set to FUNCTION.
Example of running this configurations are:
1 # the process id, app_name and .pfw will be appended by the profiler for each app and process.
2 # name of final log file is ~/log_file-<APP_NAME>-<PID>.pfw
3 DFTRACER_LOG_FILE=~/log_file
4 # Colon separated paths for including for profiler
5 DFTRACER_DATA_DIR=/dev/shm/:/p/gpfs1/$USER/dataset
6 # Set the mode to PRELOAD
7 export DFTRACER_INIT=PRELOAD
8 # Enable profiler
9 DFTRACER_ENABLE=1
C Example
Application Level Example:
 1 #include <dftracer/dftracer.h>
 2
 3 void foo() {
 4   DFTRACER_C_FUNCTION_START();
 5   sleep(1);
 6   if (<CONDITION>) {
 7     DFTRACER_C_FUNCTION_END();
 8     return; // Define DFTRACER_C_FUNCTION_END on every branch
 9   }
10   {
11     DFTRACER_C_REGION_START(CUSTOM);
12     sleep(1);
13     DFTRACER_C_REGION_END(CUSTOM); // END region CUSTOM.
14   }
15   DFTRACER_C_FUNCTION_END(); // Define DFTRACER_C_FUNCTION_END on every branch
16 }
17
18 int main(int argc, char *argv[]) {
19   // Basic Bookkeeping
20   int init = 0;
21   if (argc > 2) {
22     if (strcmp(argv[2], "1") == 0) {
23       // Initialize Application Profiler
24       DFTRACER_C_INIT(nullptr, nullptr, nullptr);
25       init = 1;
26     }
27   }
28   char filename[1024];
29   sprintf(filename, "%s/demofile.txt", argv[1]);
30
31   // Run functions
32   foo();
33   // Implicit I/O calls No need for marking.
34   FILE *fh = fopen(filename, "w+");
35   if (fh != NULL) {
36     fwrite("hello", sizeof("hello"), 1, fh);
37     fclose(fh);
38   }
39   if (init == 1) {
40     // Finalize Application Profiler
41     DFTRACER_C_FINI();
42   }
43   return 0;
44 }
For this example, link with libdftracer.so at compile time.
As the DFTRACER_CPP_INIT do not pass log file or data dir, we need to set DFTRACER_LOG_FILE and DFTRACER_DATA_DIR.
By default the DFTracer mode is set to FUNCTION.
Example of running this configurations are:
1 # the process id, app_name and .pfw will be appended by the profiler for each app and process.
2 # name of final log file is ~/log_file-<APP_NAME>-<PID>.pfw
3 DFTRACER_LOG_FILE=~/log_file
4 # Colon separated paths for including for profiler
5 DFTRACER_DATA_DIR=/dev/shm/:/p/gpfs1/$USER/dataset
6 # Enable profiler
7 DFTRACER_ENABLE=1
LD_PRELOAD Example:
 1 #include <dftracer/dftracer.h>
 2
 3 int main(int argc, char *argv[]) {
 4   char filename[1024];
 5   sprintf(filename, "%s/demofile.txt", argv[1]);
 6   foo(); # function will be ignored in pure LD_PRELOAD mode.
 7   // Implicit I/O calls No need for marking.
 8   FILE *fh = fopen(filename, "w+");
 9   if (fh != NULL) {
10     fwrite("hello", sizeof("hello"), 1, fh);
11     fclose(fh);
12   }
13   return 0;
14 }
For this example, LD_PRELOAD the executable with libdftracer_preload.so at runtime.
We need to set DFTRACER_LOG_FILE and DFTRACER_DATA_DIR.
Example of running this configurations are:
1 # the process id, app_name and .pfw will be appended by the profiler for each app and process.
2 # name of final log file is ~/log_file-<APP_NAME>-<PID>.pfw
3 export DFTRACER_LOG_FILE=~/log_file
4 # Colon separated paths for including for profiler
5 export DFTRACER_DATA_DIR=/dev/shm/:/p/gpfs1/$USER/dataset
6 # Set the mode to PRELOAD
7 export DFTRACER_INIT=PRELOAD
8 # Enable profiler
9 export DFTRACER_ENABLE=1
Hybrid Example:
 1 #include <dftracer/dftracer.h>
 2
 3 void foo() {
 4   DFTRACER_C_FUNCTION_START();
 5   sleep(1);
 6   if (<CONDITION>) {
 7     DFTRACER_C_FUNCTION_END();
 8     return; // Define DFTRACER_C_FUNCTION_END on every branch
 9   }
10   {
11     DFTRACER_C_REGION_START(CUSTOM);
12     sleep(1);
13     DFTRACER_C_REGION_END(CUSTOM); // END region CUSTOM.
14   }
15   DFTRACER_C_FUNCTION_END(); // Define DFTRACER_C_FUNCTION_END on every branch
16 }
17
18 int main(int argc, char *argv[]) {
19   // Basic Bookkeeping
20   int init = 0;
21   if (argc > 2) {
22     if (strcmp(argv[2], "1") == 0) {
23       // Initialize Application Profiler
24       DFTRACER_C_INIT(nullptr, nullptr, nullptr);
25       init = 1;
26     }
27   }
28   char filename[1024];
29   sprintf(filename, "%s/demofile.txt", argv[1]);
30
31   // Run functions
32   foo();
33   // Implicit I/O calls No need for marking.
34   FILE *fh = fopen(filename, "w+");
35   if (fh != NULL) {
36     fwrite("hello", sizeof("hello"), 1, fh);
37     fclose(fh);
38   }
39   if (init == 1) {
40     // Finalize Application Profiler
41     DFTRACER_C_FINI();
42   }
43   return 0;
44 }
For this example, link with libdftracer.so at compile time and LD_PRELOAD the executable with libdftracer_preload.so at runtime.
As the DFTRACER_CPP_INIT do not pass log file or data dir, we need to set DFTRACER_LOG_FILE and DFTRACER_DATA_DIR.
By default the DFTracer mode is set to FUNCTION.
Example of running this configurations are:
1 # the process id, app_name and .pfw will be appended by the profiler for each app and process.
2 # name of final log file is ~/log_file-<APP_NAME>-<PID>.pfw
3 DFTRACER_LOG_FILE=~/log_file
4 # Colon separated paths for including for profiler
5 DFTRACER_DATA_DIR=/dev/shm/:/p/gpfs1/$USER/dataset
6 # Set the mode to PRELOAD
7 export DFTRACER_INIT=PRELOAD
8 # Enable profiler
9 DFTRACER_ENABLE=1
Python Example
Application Level Example:
 1 from dftracer.logger import dftracer, dft_fn
 2 log_inst = dftracer.initialize_log(logfile=None, data_dir=None, process_id=-1)
 3 dft_fn = dft_fn("COMPUTE")
 4
 5 # Example of using function decorators
 6 @dft_fn.log
 7 def log_events(index):
 8     sleep(1)
 9
10 # Example of function spawning and implicit I/O calls
11 def posix_calls(val):
12     index, is_spawn = val
13     path = f"{cwd}/data/demofile{index}.txt"
14     f = open(path, "w+")
15     f.write("Now the file has more content!")
16     f.close()
17     if is_spawn:
18         print(f"Calling spawn on {index} with pid {os.getpid()}")
19         log_inst.finalize() # This need to be called to correctly finalize DFTracer.
20     else:
21         print(f"Not calling spawn on {index} with pid {os.getpid()}")
22
23 # NPZ calls internally calls POSIX calls.
24 def npz_calls(index):
25     # print(f"{cwd}/data/demofile2.npz")
26     path = f"{cwd}/data/demofile{index}.npz"
27     if os.path.exists(path):
28         os.remove(path)
29     records = np.random.randint(255, size=(8, 8, 1024), dtype=np.uint8)
30     record_labels = [0] * 1024
31     np.savez(path, x=records, y=record_labels)
32
33 def main():
34     log_events(0)
35     npz_calls(1)
36     with get_context('spawn').Pool(1, initializer=init) as pool:
37         pool.map(posix_calls, ((2, True),))
38     log_inst.finalize()
39
40 if __name__ == "__main__":
41     main()
For this example, as the DFTRACER_CPP_INIT do not pass log file or data dir, we need to set DFTRACER_LOG_FILE and DFTRACER_DATA_DIR.
By default the DFTracer mode is set to FUNCTION.
Example of running this configurations are:
1 # the process id, app_name and .pfw will be appended by the profiler for each app and process.
2 # name of final log file is ~/log_file-<APP_NAME>-<PID>.pfw
3 DFTRACER_LOG_FILE=~/log_file
4 # Colon separated paths for including for profiler
5 DFTRACER_DATA_DIR=/dev/shm/:/p/gpfs1/$USER/dataset:$PWD/data
6 # Enable profiler
7 DFTRACER_ENABLE=1
LD_PRELOAD Example:
 1 # Example of function spawning and implicit I/O calls
 2 def posix_calls(val):
 3     index, is_spawn = val
 4     path = f"{cwd}/data/demofile{index}.txt"
 5     f = open(path, "w+")
 6     f.write("Now the file has more content!")
 7     f.close()
 8     if is_spawn:
 9         print(f"Calling spawn on {index} with pid {os.getpid()}")
10     else:
11         print(f"Not calling spawn on {index} with pid {os.getpid()}")
12
13 # NPZ calls internally calls POSIX calls.
14 def npz_calls(index):
15     # print(f"{cwd}/data/demofile2.npz")
16     path = f"{cwd}/data/demofile{index}.npz"
17     if os.path.exists(path):
18         os.remove(path)
19     records = np.random.randint(255, size=(8, 8, 1024), dtype=np.uint8)
20     record_labels = [0] * 1024
21     np.savez(path, x=records, y=record_labels)
22
23 def main():
24     npz_calls(1)
25     with get_context('spawn').Pool(1, initializer=init) as pool:
26         pool.map(posix_calls, ((2, True),))
27
28 if __name__ == "__main__":
29     main()
For this example, LD_PRELOAD the executable with libdftracer_preload.so at runtime.
We need to set DFTRACER_LOG_FILE and DFTRACER_DATA_DIR.
Example of running this configurations are:
1 # the process id, app_name and .pfw will be appended by the profiler for each app and process.
2 # name of final log file is ~/log_file-<APP_NAME>-<PID>.pfw
3 export DFTRACER_LOG_FILE=~/log_file
4 # Colon separated paths for including for profiler
5 export DFTRACER_DATA_DIR=/dev/shm/:/p/gpfs1/$USER/dataset
6 # Set the mode to PRELOAD
7 export DFTRACER_INIT=PRELOAD
8 # Enable profiler
9 export DFTRACER_ENABLE=1
Hybrid Example:
 1 from dftracer.logger import dftracer, dft_fn
 2 log_inst = dftracer.initialize_log(logfile=None, data_dir=None, process_id=-1)
 3 dft_fn = dft_fn("COMPUTE")
 4
 5 # Example of using function decorators
 6 @dft_fn.log
 7 def log_events(index):
 8     sleep(1)
 9
10 # Example of function spawning and implicit I/O calls
11 def posix_calls(val):
12     index, is_spawn = val
13     path = f"{cwd}/data/demofile{index}.txt"
14     f = open(path, "w+")
15     f.write("Now the file has more content!")
16     f.close()
17     if is_spawn:
18         print(f"Calling spawn on {index} with pid {os.getpid()}")
19         log_inst.finalize() # This need to be called to correctly finalize DFTracer.
20     else:
21         print(f"Not calling spawn on {index} with pid {os.getpid()}")
22
23 # NPZ calls internally calls POSIX calls.
24 def npz_calls(index):
25     # print(f"{cwd}/data/demofile2.npz")
26     path = f"{cwd}/data/demofile{index}.npz"
27     if os.path.exists(path):
28         os.remove(path)
29     records = np.random.randint(255, size=(8, 8, 1024), dtype=np.uint8)
30     record_labels = [0] * 1024
31     np.savez(path, x=records, y=record_labels)
32
33 def main():
34     log_events(0)
35     npz_calls(1)
36     with get_context('spawn').Pool(1, initializer=init) as pool:
37         pool.map(posix_calls, ((2, True),))
38     log_inst.finalize()
39
40 if __name__ == "__main__":
41     main()
For this example, use LD_PRELOAD the executable with libdftracer_preload.soat runtime.
As the DFTRACER_CPP_INIT do not pass log file or data dir, we need to set DFTRACER_LOG_FILE and DFTRACER_DATA_DIR.
By default the DFTracer mode is set to FUNCTION.
Example of running this configurations are:
1 # the process id, app_name and .pfw will be appended by the profiler for each app and process.
2 # name of final log file is ~/log_file-<APP_NAME>-<PID>.pfw
3 DFTRACER_LOG_FILE=~/log_file
4 # Colon separated paths for including for profiler
5 DFTRACER_DATA_DIR=/dev/shm/:/p/gpfs1/$USER/dataset
6 # Set the mode to PRELOAD
7 export DFTRACER_INIT=PRELOAD
8 # Enable profiler
9 DFTRACER_ENABLE=1
Resnet50 with pytorch and torchvision example from ALCF Polaris:
Create a separate conda environment for the application and install dftracer
 1  #!/bin/bash +x
 2  set -e
 3  set -x
 4  export MODULEPATH=/soft/modulefiles/conda/:$MODULEPATH
 5  module load 2023-10-04  # This is the latest conda module on Polaris
 6
 7  export ML_ENV=$PWD/PolarisAT/conda-envs/ml_workload_latest_conda_2 # Please change the following path accordingly
 8
 9  if [[ -e $ML_ENV ]]; then
10      conda activate $ML_ENV
11  else
12      conda create  -p $ML_ENV --clone  /soft/datascience/conda/2023-10-04/mconda3/
13      conda activate $ML_ENV
14      yes | MPICC="cc -shared -target-accel=nvidia80" pip install --force-reinstall --no-cache-dir --no-binary=mpi4py mpi4py
15      yes | pip install --no-cache-dir git+https://github.com/hariharan-devarajan/dftracer.git
16      pip uninstall -y torch horovod
17      yes | pip install --no-cache-dir horovod
18      #INSTALL OTHER MISSING FILES
19  fi
Since, torchvision.datasets.ImageFolder spawns separate python processes to help the parallel data loading in torch, we will be using the HYBRID MODE of the DFTracer (e.g., see Python Hybrid mode), so that the application can use both APP and PRELOAD Mode to log I/O from all dynamically spawned processes and function profiling from application.
The following dftracer code is added to profile the application at the function level. Note: dftracer python level log file location is provided inside the python code in the dftracer.initialize_log() function and the POSIX or STDIO calls level log file location is provided in the job scirpt environment variable DFTRACER_LOG_FILE
 1  ...
 2  # From the preamble
 3  from dftracer.logger import dftracer as logger, dft_fn as dft_event_logging
 4  dft_pid=os.getpid()
 5  log_inst=logger.initialize_log(f"./resnet50/dft_fn_py_level-{dft_pid}.pfw", "", dft_pid)
 6  compute_dft = dft_event_logging("Compute")
 7  io_dft = dft_event_logging("IO", name="real_IO")
 8  ...
 9  # From the train() function
10  for i, (images, target) in io_dft.iter(enumerate(train_loader)):
11        with dft_event_logging("communication-except-io", name="cpu-gpu-transfer", step=i, epoch=epoch) as transfer:
12            images = images.to(device)
13            target = target.to(device)
14        with dft_event_logging("compute", name="model-compute-forward-prop", step=i, epoch=epoch) as compute:
15            output = model(images)
16            loss = criterion(output, target)
17        with dft_event_logging("compute", name="model-compute-backward-prop", step=i, epoch=epoch) as compute:
18            acc1, acc5 = accuracy(output, target, topk=(1, 5))
19            losses.update(loss.item(), images.size(0))
20            top1.update(acc1[0], images.size(0))
21            top5.update(acc5[0], images.size(0))
22
23  ...
24  # At the end of main function
25  log_inst.finalize()
Job submition script
 1  export MODULEPATH=/soft/modulefiles/conda/:$MODULEPATH
 2  module load 2023-10-04
 3  conda activate./dlio_ml_workloads/PolarisAT/conda-envs/ml_workload_latest_conda
 4
 5  export LD_LIBRARY_PATH=$env_path/lib/:$LD_LIBRARY_PATH
 6  export DFTRACER_LOG_LEVEL=ERROR
 7  export DFTRACER_ENABLE=1
 8  export DFTRACER_INC_METADATA=1
 9  export DFTRACER_INIT=PRELOAD
10  export DFTRACER_DATA_DIR=./resnet_original_data #Path to the orignal resnet 50 dataset
11  export DFTRACER_LOG_FILE=./dft_fn_posix_level.pfw
12
13  LD_PRELOAD=./dlio_ml_workloads/PolarisAT/conda-envs/ml_workload_latest_conda/lib/python*/site-packages/dftracer/lib/libdftracer_preload.so aprun -n 4 -N 4 python resnet_hvd_dlio.py --batch-size 64 --epochs 1 > dft_fn 2>&1
14
15  cat *.pfw > combined_logs.pfw # To combine to a single pfw file.
Integrated Applications
Here is the list applications that currently use DFTracer.
MuMMI
Resnet50 with pytorch and torchvision
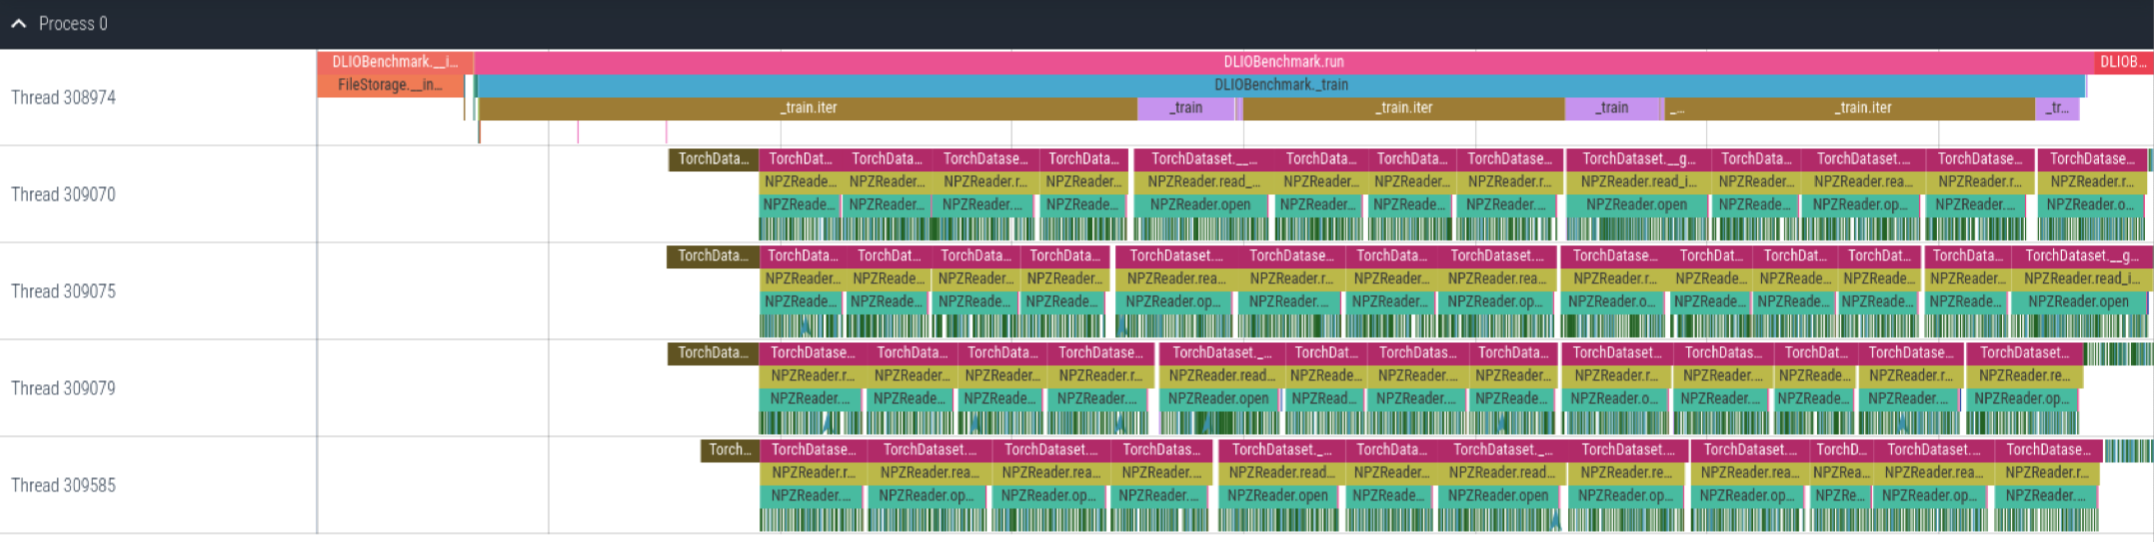
Example Chrome Tracing Plots
Example of Unet3D application with DLIO Benchmark. This trace shows the first few steps of the benchmark.
Here, we can see that we can get application level calls (e.g., train and TorchDataset) as well as low-level I/O calls (dark green color).