Overlap Analysis
This section describes how to run I/O and Computation Analysis on DFAnalyzer.
Make sure you already did the necessary steps to build the dfanalyzer here.
Overlap vs Non-overlap Analysis
When we build our model and utilizing our dataloader with multiple dataloader workers and prefetching, we hope that data loading can be hidden behind the computation.
In this case, we call this as “Best Case” because the I/O and computation are overlapped.
However, in some cases, the I/O and computation are not overlapped due to faster computation time compared to I/O time (e.g. bandwidth in the filesystem is not fully utilized).
For this, we can analyze the overlap between I/O and computation using the dfanalyzer.
This page will guide you how to do overlap analysis on top of dftracer and dfanalyzer.
Note
This tutorial assume you use Pytorch, however, this technique can be applied to other frameworks as well.
Annotating using DFTracer
Assume we have training loop similar to this:
def forward(model: torch.nn.Module, x: torch.Tensor):
    ... # additional actions here
    output = model(x)
    ...
    return output

def training(model, optimizer, dataloader, num_epoch):
    for epoch in range(num_epoch):
        for batch in dataloader:
           optimizer.zero_grad()
           out = forward(batch)
           loss = calculate_loss(out)
           loss.backward()
           optimizer.step()
Now, we need to modify code a bit to annotate computation and I/O using dftracer
from dftracer.python import dft_fn as Profile

dlp_computation = Profile("computation")
#                               ^
# will be map as:              "cat"
dlp_io = Profile("IO", "real_IO")
#                  ^       ^
# will be map as: "cat"  "name"

@dlp_computation.log # here we annotate as this computation
def forward(model: torch.nn.Module, x: torch.Tensor):
    ...
    output = model(x)
    ...
    return output

def training(model, optimizer, dataloader, num_epoch):
    for epoch in range(num_epoch):
        for batch in dlp_io.iter(dataloader): # we annotate this as I/O
           optimizer.zero_grad()
           out = forward(batch)
           loss = calculate_loss(out)
           loss.backward()
           optimizer.step()

# or maybe even better, annotate the __getitem__ or iterable in your dataset

# dlp_dataset = Profile("MyDataset")
# class MyDataset(torch.utils.data.Dataset):
#     def __len__(self):
#         return len(self.data)

#     @dlp_dataset.log
#     def __getitem__(self, idx: int):
#         ...
Analysis using DFAnalyzer
Now, let’s open the dfanalyzer-distributed.ipynb in the examples/dfanalyzer directory.
Let’s tweak function get_conditions_stormer and change it to get_conditions_<MY_MODEL>. Let’s assume <MY_MODEL> is “cool_ml” in this example.
def get_conditions_cool_ml(json_object):
    app_io_econd = (
        "IO" in json_object["cat"] # <----- specify "IO" cat as App I/O
    )  # I/O has that application is issuing
    compute_cond = "compute" in json_object["cat"] # <----- specify "cat" cat as Computation
    io_cond = json_object["cat"] in ["POSIX", "STDIO"] # <---- leave this as default because dftracer will give the cat for you
    return app_io_cond, compute_cond, io_cond
Scroll down a bit in the same notebook file, and replace get_conditions_stormer with get_conditions_cool_ml
conf = update_dft_configuration(
    dask_scheduler=dask_scheduler,
    verbose=True,
    workers=4,
    time_granularity=80e6,
    log_file=f"./df_{os.getenv('USER')}.log",
    conditions=get_conditions_cool_ml, # <---- replace this
)
Now, scroll down and modify analyzer variable in the same notebook file
analyzer = DFAnalyzer(f"<LOCATION OF YOUR TRACE FILES>/*.pfw.gz") # <-- it supports globbing!
Now, after that, just execute the whole notebook and notice specifically at the line where we call
items = analyzer.summary()
items
If it runs successfully, you should see the summary of the overlap analysis. Below, is the example:
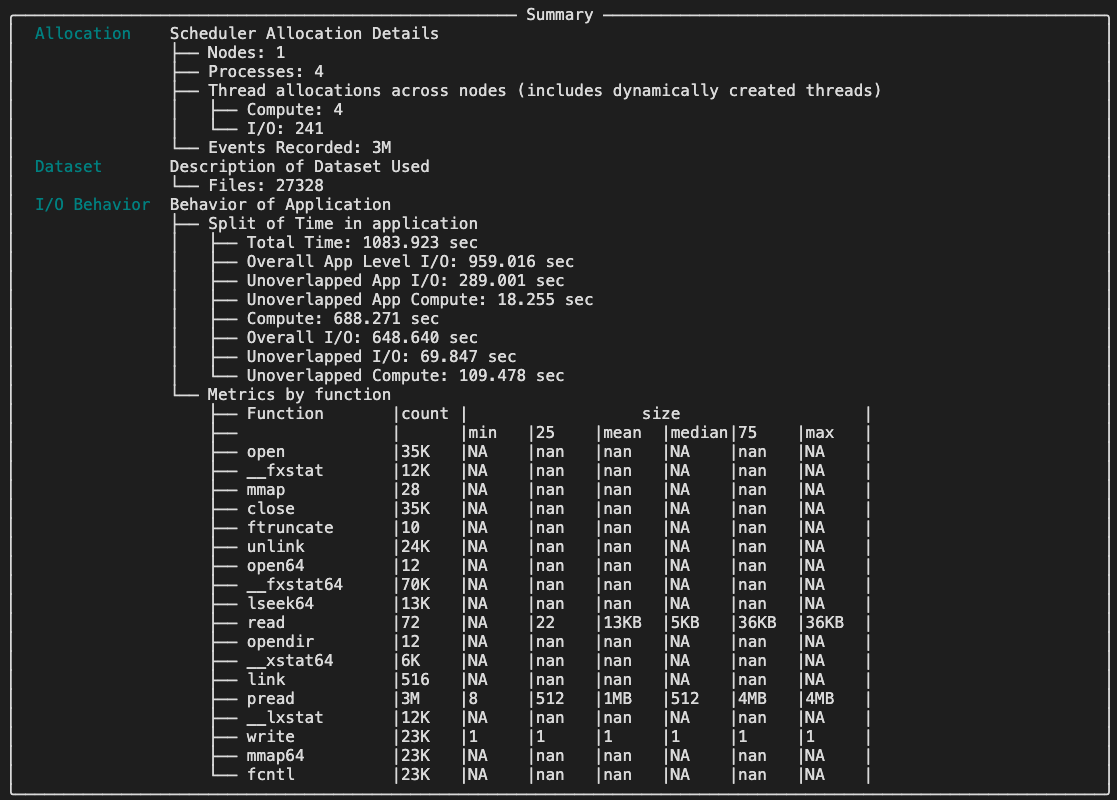
- alt:
Overlap Analysis Summary
Here, we can see the info about Unoverlapped App I/O and Unoverlapped I/O which tell you how severe (in time unit) your I/O and computation are not overlapped.