Trace Viewer (Web UI)
dftracer_server serves an interactive, query-on-demand web UI for exploring
traces. Every viewport change re-queries the server at the right level of
detail, so it stays responsive on large traces. The UI is compiled into the
binary; no separate web server or Node runtime is needed at run time.
Opening the viewer
Start the server on a trace directory and open the printed URL:
dftracer_server -d /path/to/traces
# then open http://127.0.0.1:8080/
The server also serves:
/- the timeline viewer (below)./api- an interactive API explorer./api/openapi.json- the OpenAPI 3.1 spec (see HTTP Server).
From VS Code, install the DFTracer Viewer
extension (source): it
embeds the same UI, downloads a prebuilt server from dftracer-utils-prebuilds for you, and opens a
trace when you click a .pfw / .pfw.gz file. It also works over
Remote-SSH, running the server on the remote host.
The timeline
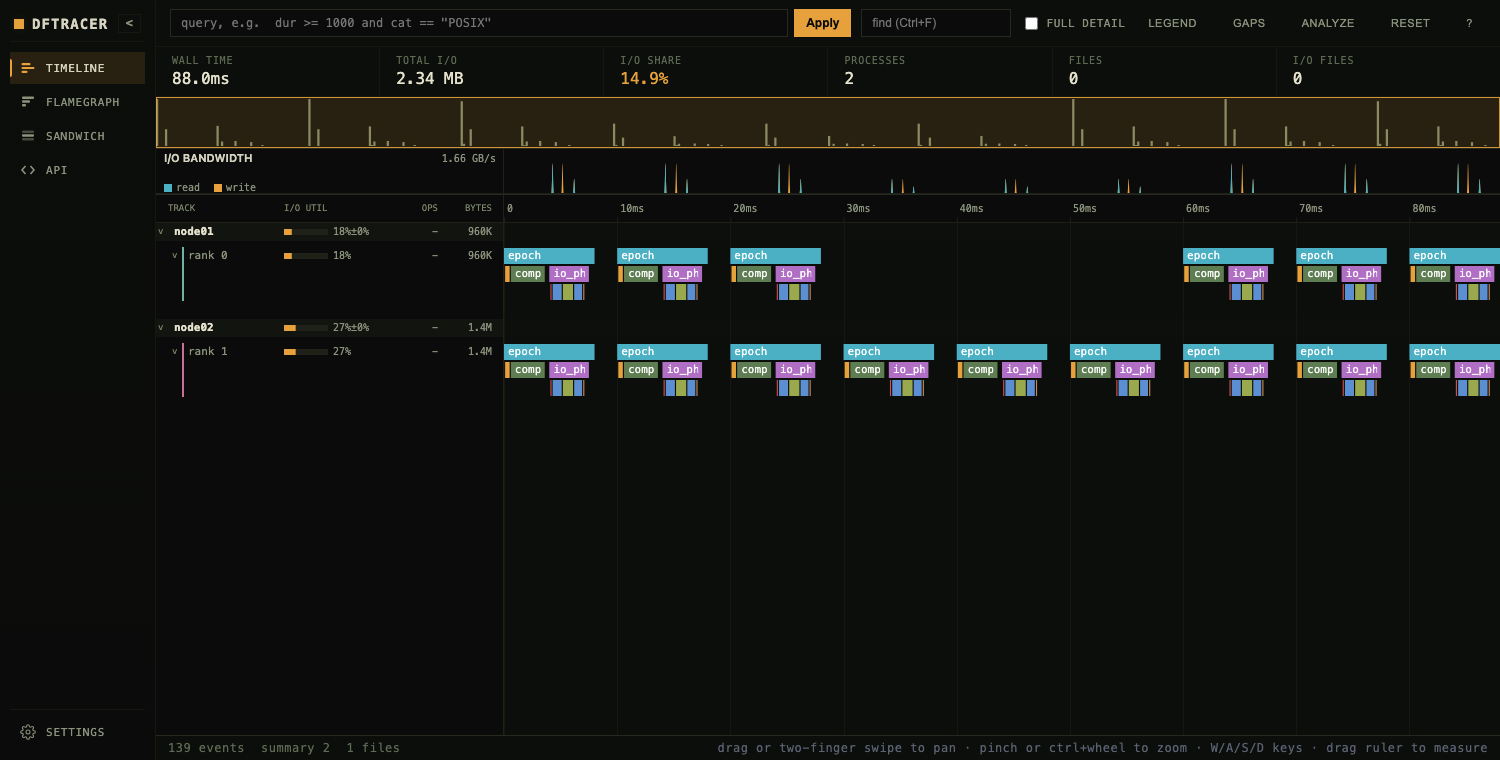
The main view is a Perfetto-style timeline:
Lanes are grouped by node/host. When the trace carries
PR(rank) metadata, nodes are ordered by their lowest rank and the ranks sort within each node; otherwise nodes order by first activity. Each process expands into its threads.Density level-of-detail: zoomed out, sub-pixel events are aggregated into density blocks so activity is still visible; zoom in and individual event slices load. Depth (call nesting) is stable across zoom.
KPIs across the top: wall time, total I/O, I/O share, processes, files, and I/O files.
I/O bandwidth strip: stacked read/write bytes over time.
Gutter metrics per lane: I/O utilization, ops/s, and bytes (host rows show the mean and spread across their ranks).
Pan with drag or two-finger swipe; zoom with pinch or ctrl/cmd+wheel; W/A/S/D
also navigate. Drag on the ruler to measure a range.
Query, search, and detail
Query box: filter with the full DSL, e.g.
dur >= 1000 and cat ==
"POSIX"
. Invalid queries surface the server’s error.Find highlights matching slices and steps between them.
Hover a slice for a tooltip (name, category, duration, pid/tid, args); click to pin it in the inspector, which lists every field and arbitrary
args.Full detail disables level-of-detail aggregation for the current view.
Keyboard and mouse
Input |
Action |
|---|---|
Drag, or two-finger swipe |
Pan time |
Pinch, or Ctrl/Cmd + wheel |
Zoom at the cursor |
Shift + wheel |
Pan time (mouse-wheel users) |
Wheel (vertical) |
Scroll lanes |
|
Zoom in / out at the cursor |
|
Pan left / right |
Double-click |
Zoom toward the cursor |
Drag on the ruler, or Shift + drag |
Select a time range to analyze |
Click a slice / click empty |
Pin it in the inspector / clear the selection |
|
Clear the selection or close a panel |
Ctrl/Cmd + |
Focus the find box ( |
Click a frame / parent frame (flamegraph) |
Zoom in / out |
Flamegraph and sandwich
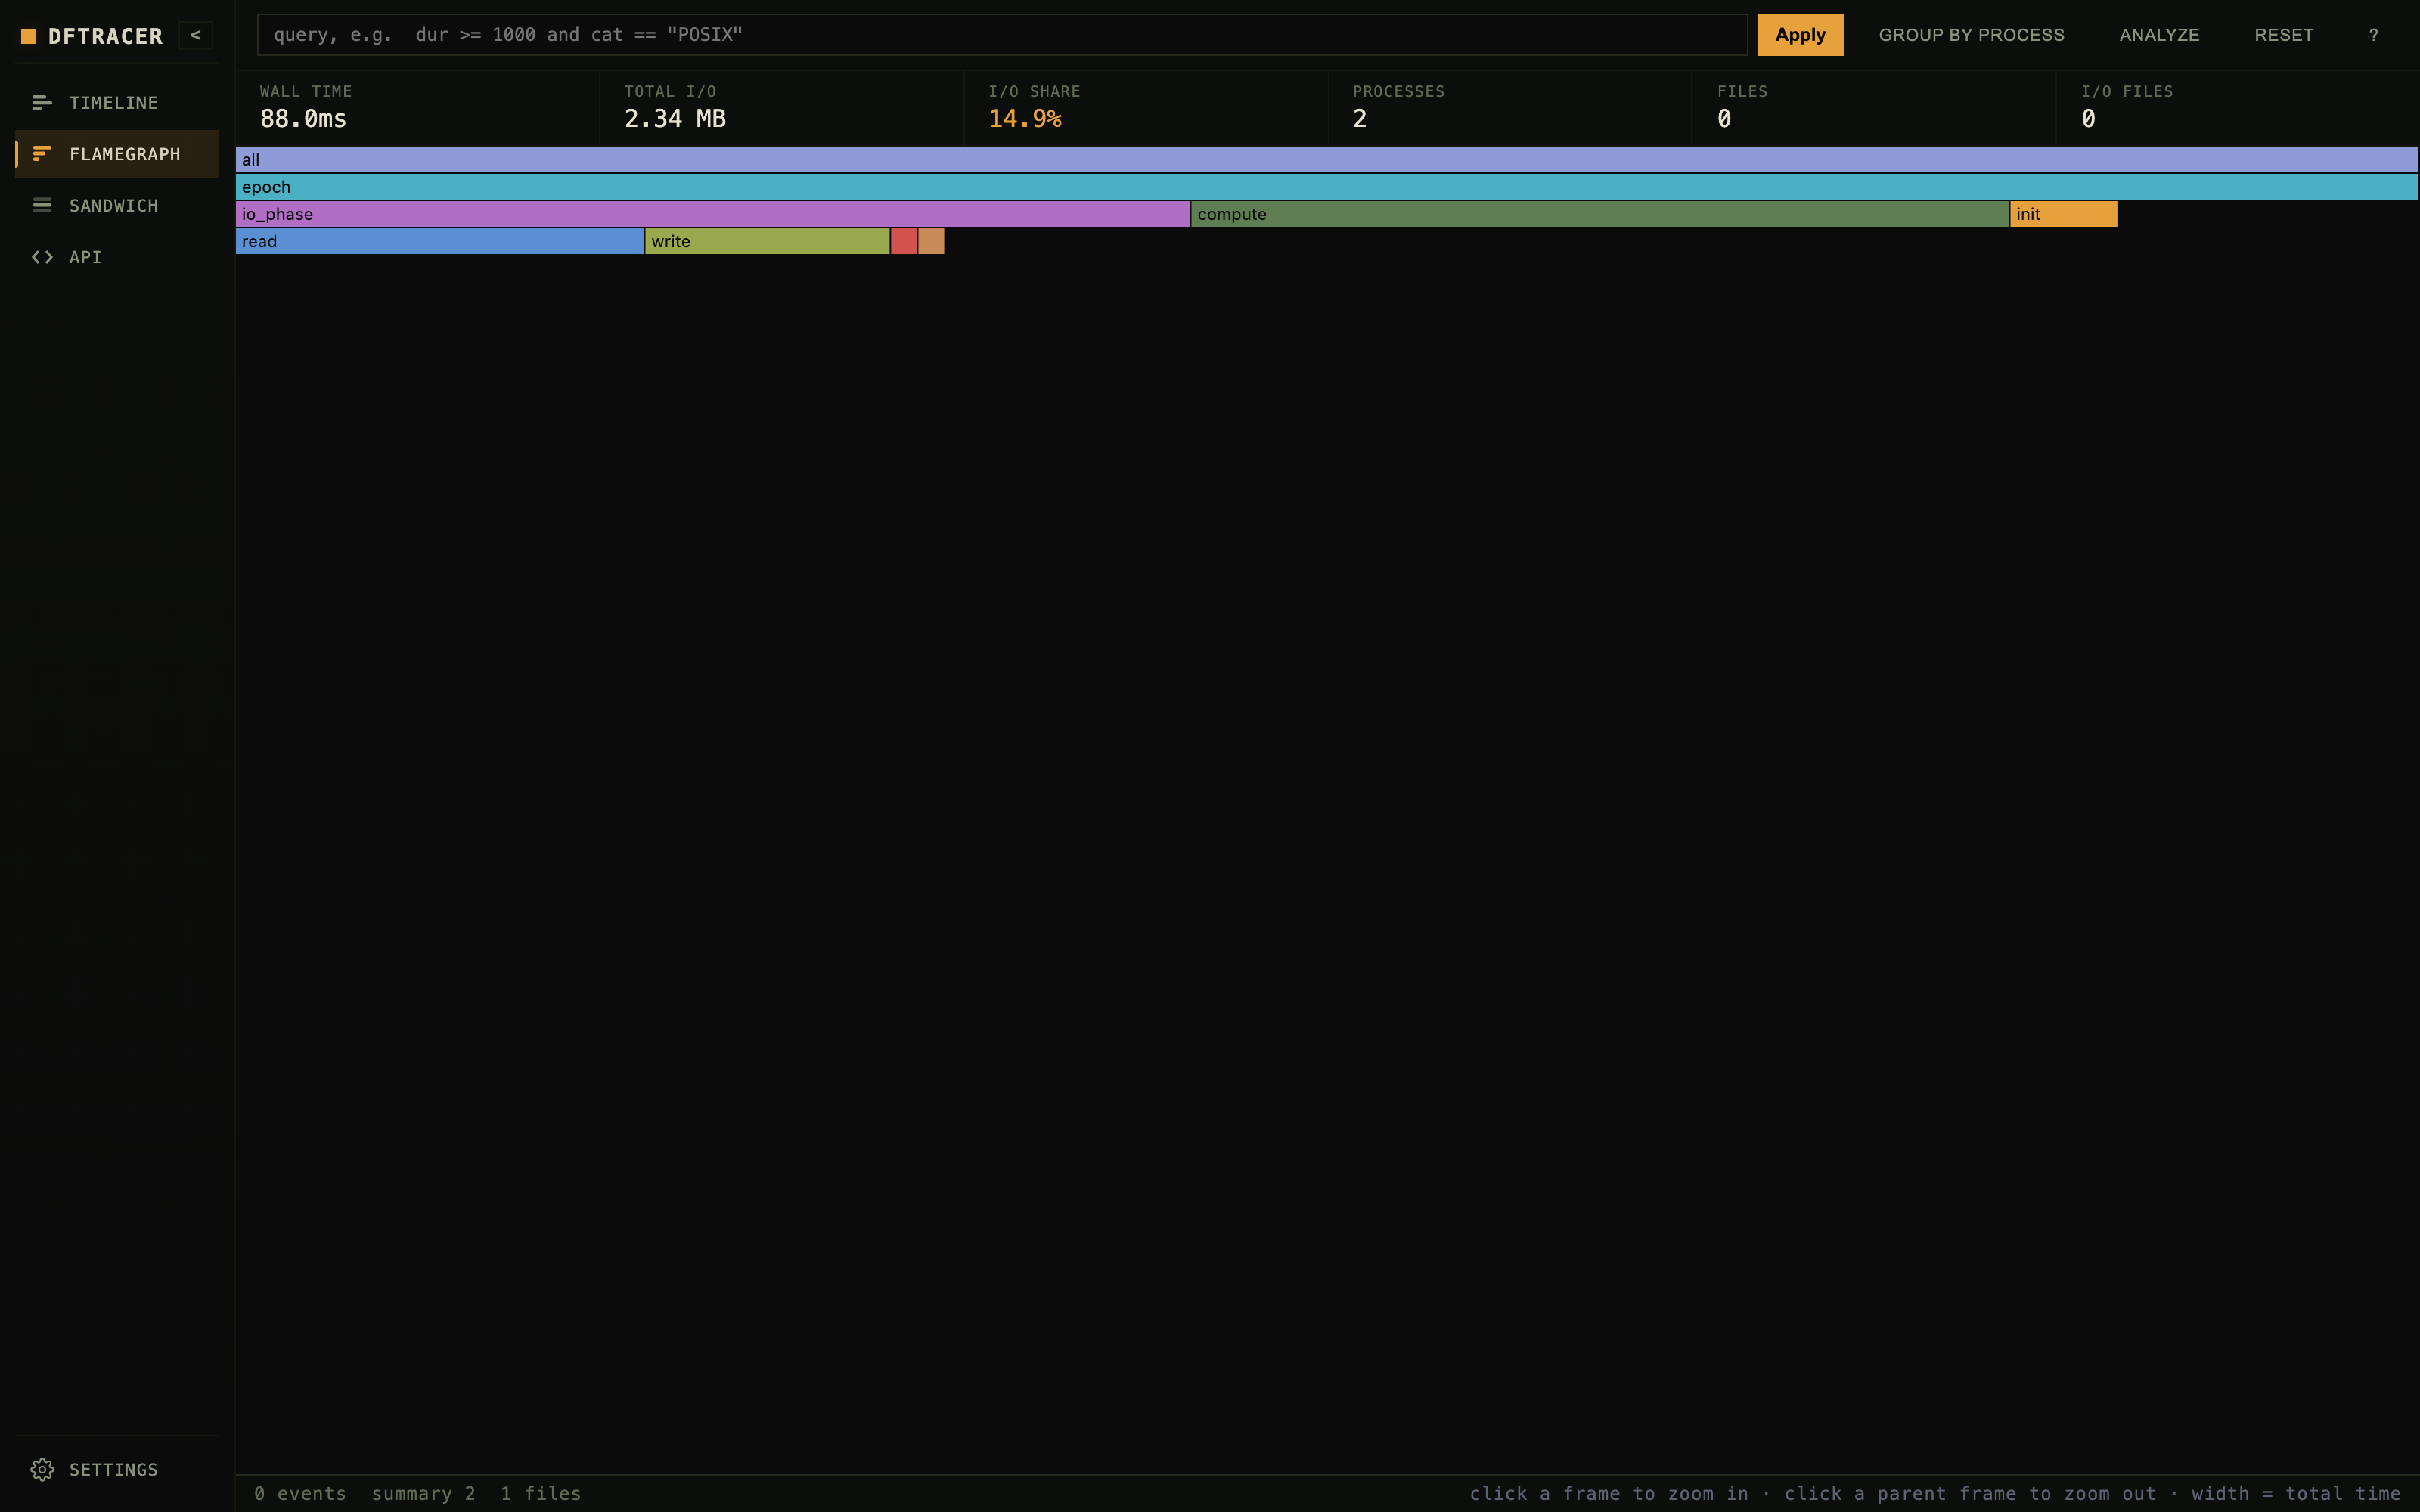
The Flamegraph (icicle) is the merged call tree built from ts/dur
containment; identical name-paths fold together, and width is proportional to
inclusive time. Click a frame to zoom in, click a parent frame to zoom out.
Toggle Group by process to keep each process’s tree separate.
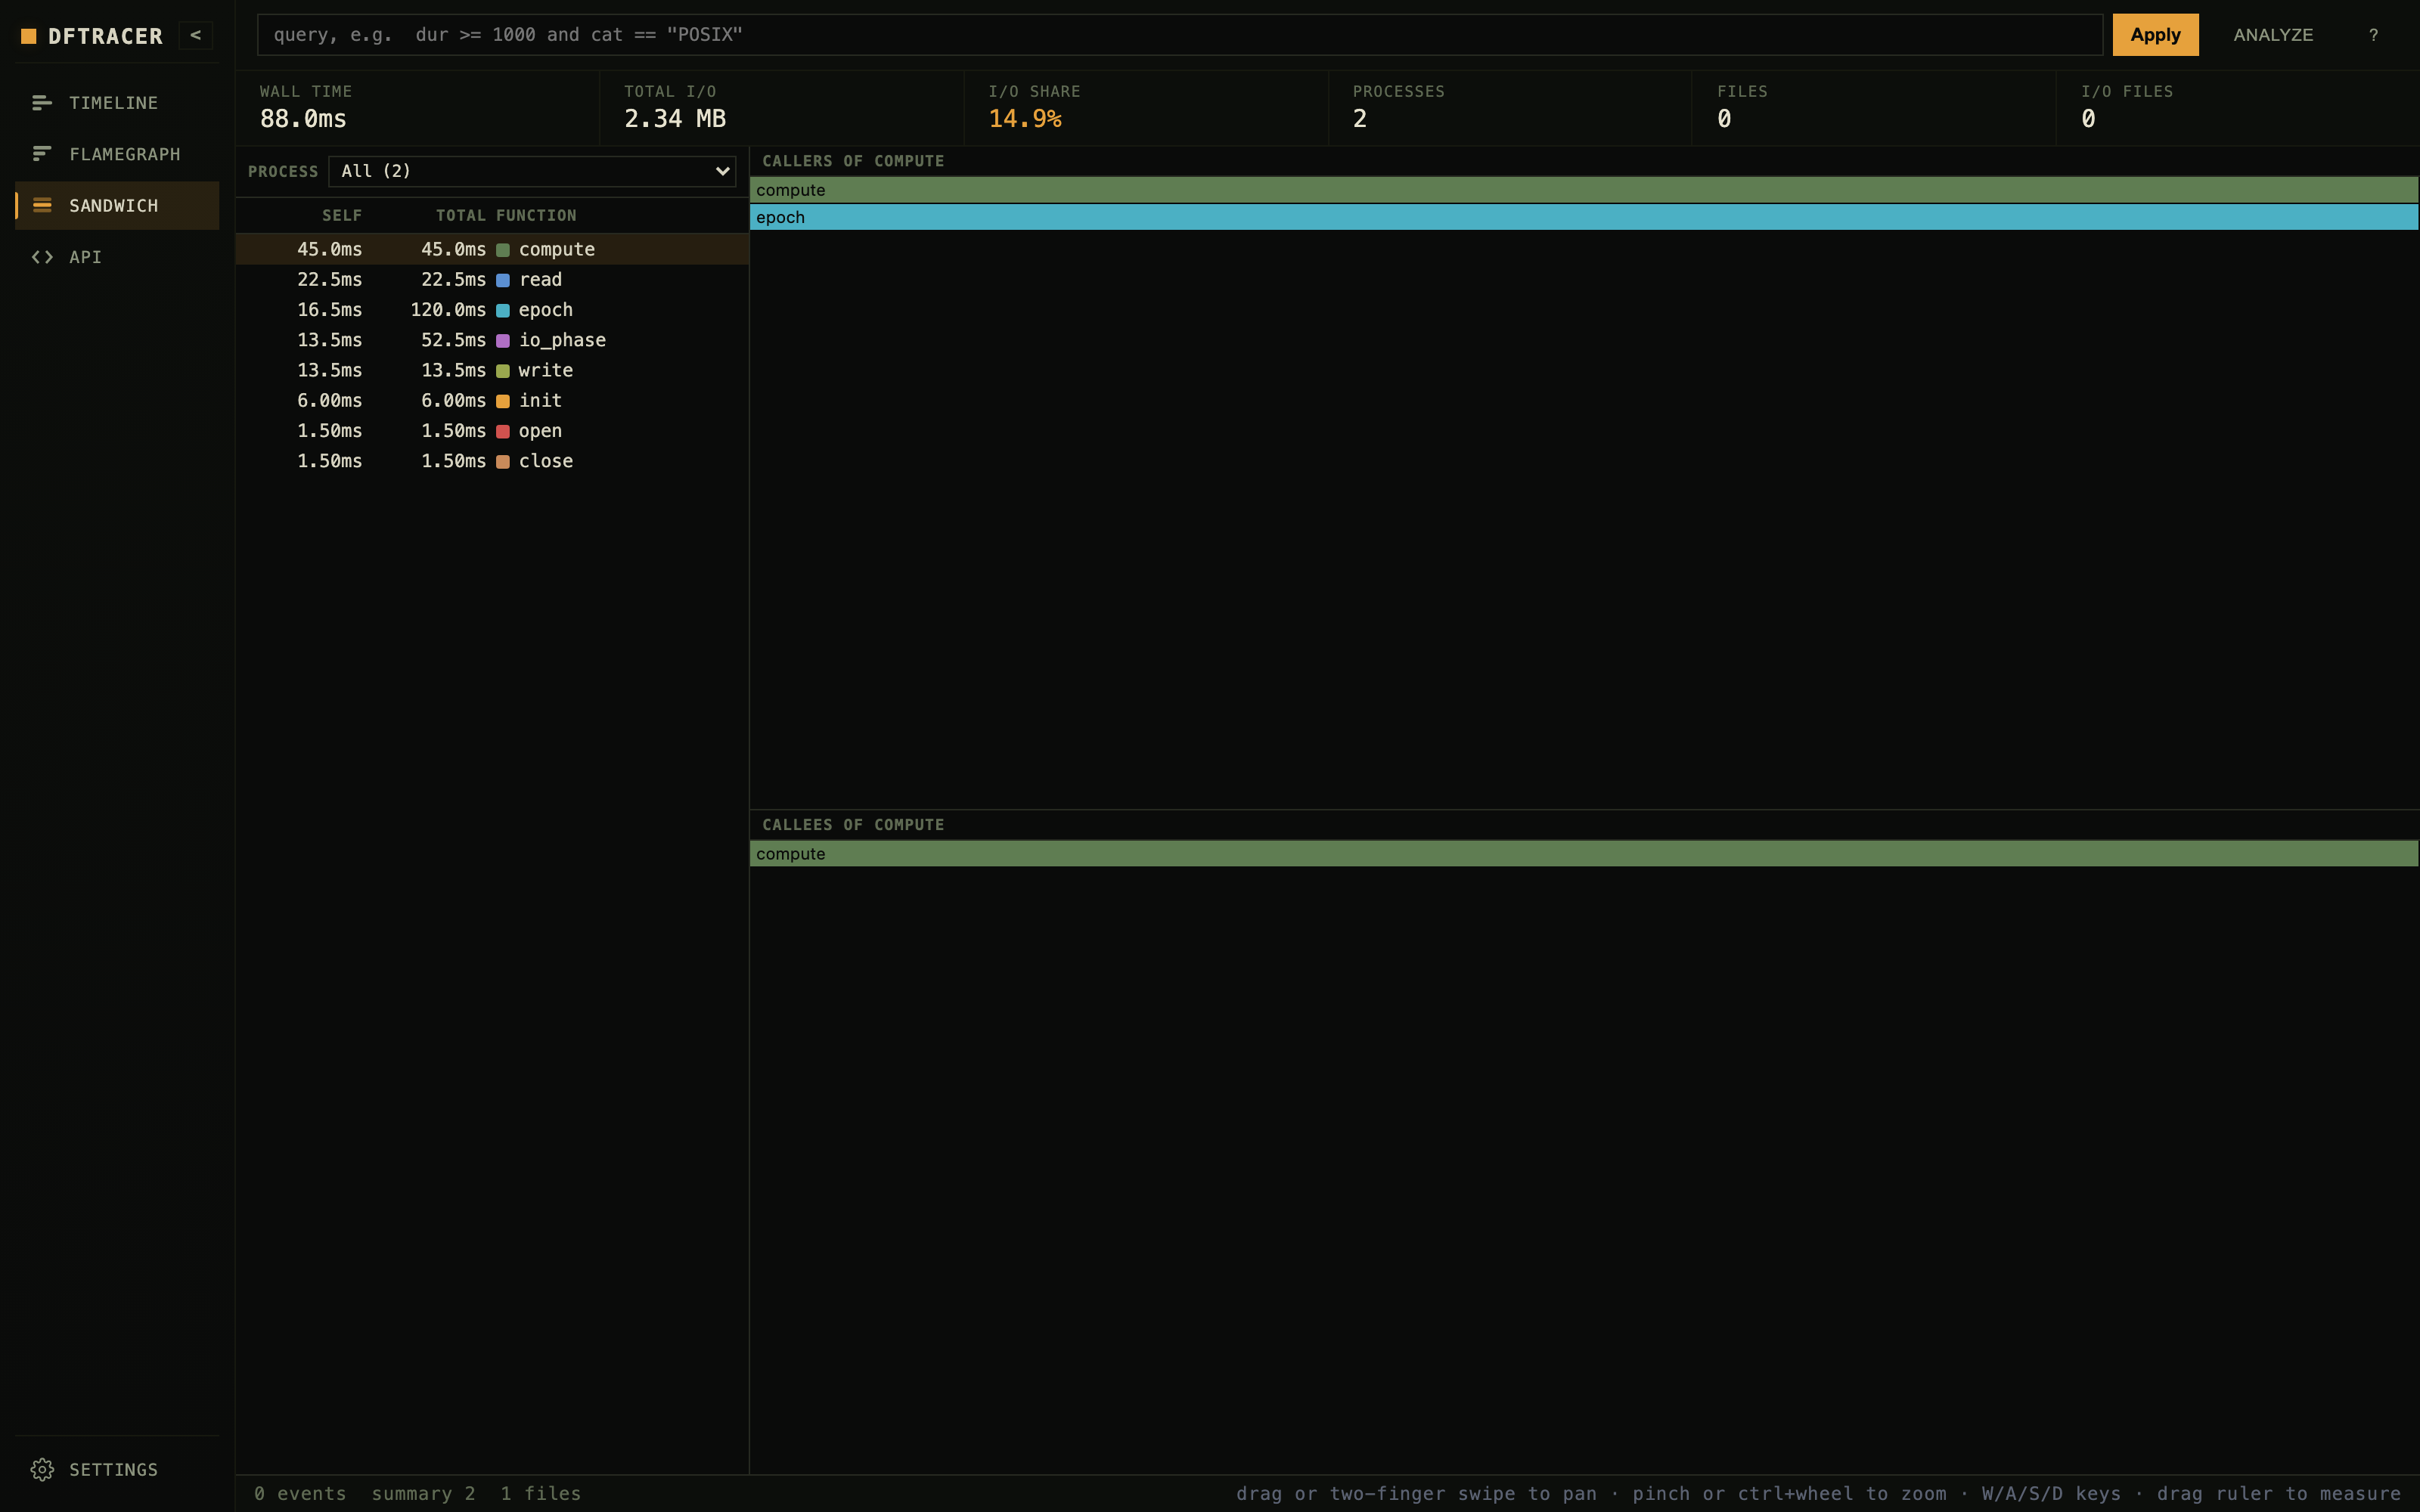
The Sandwich (Speedscope-style) view lists every function with its self and total time; selecting one shows its callers (inverted) and callees flamegraphs. Scope it to a single process with the dropdown.
Gap analysis
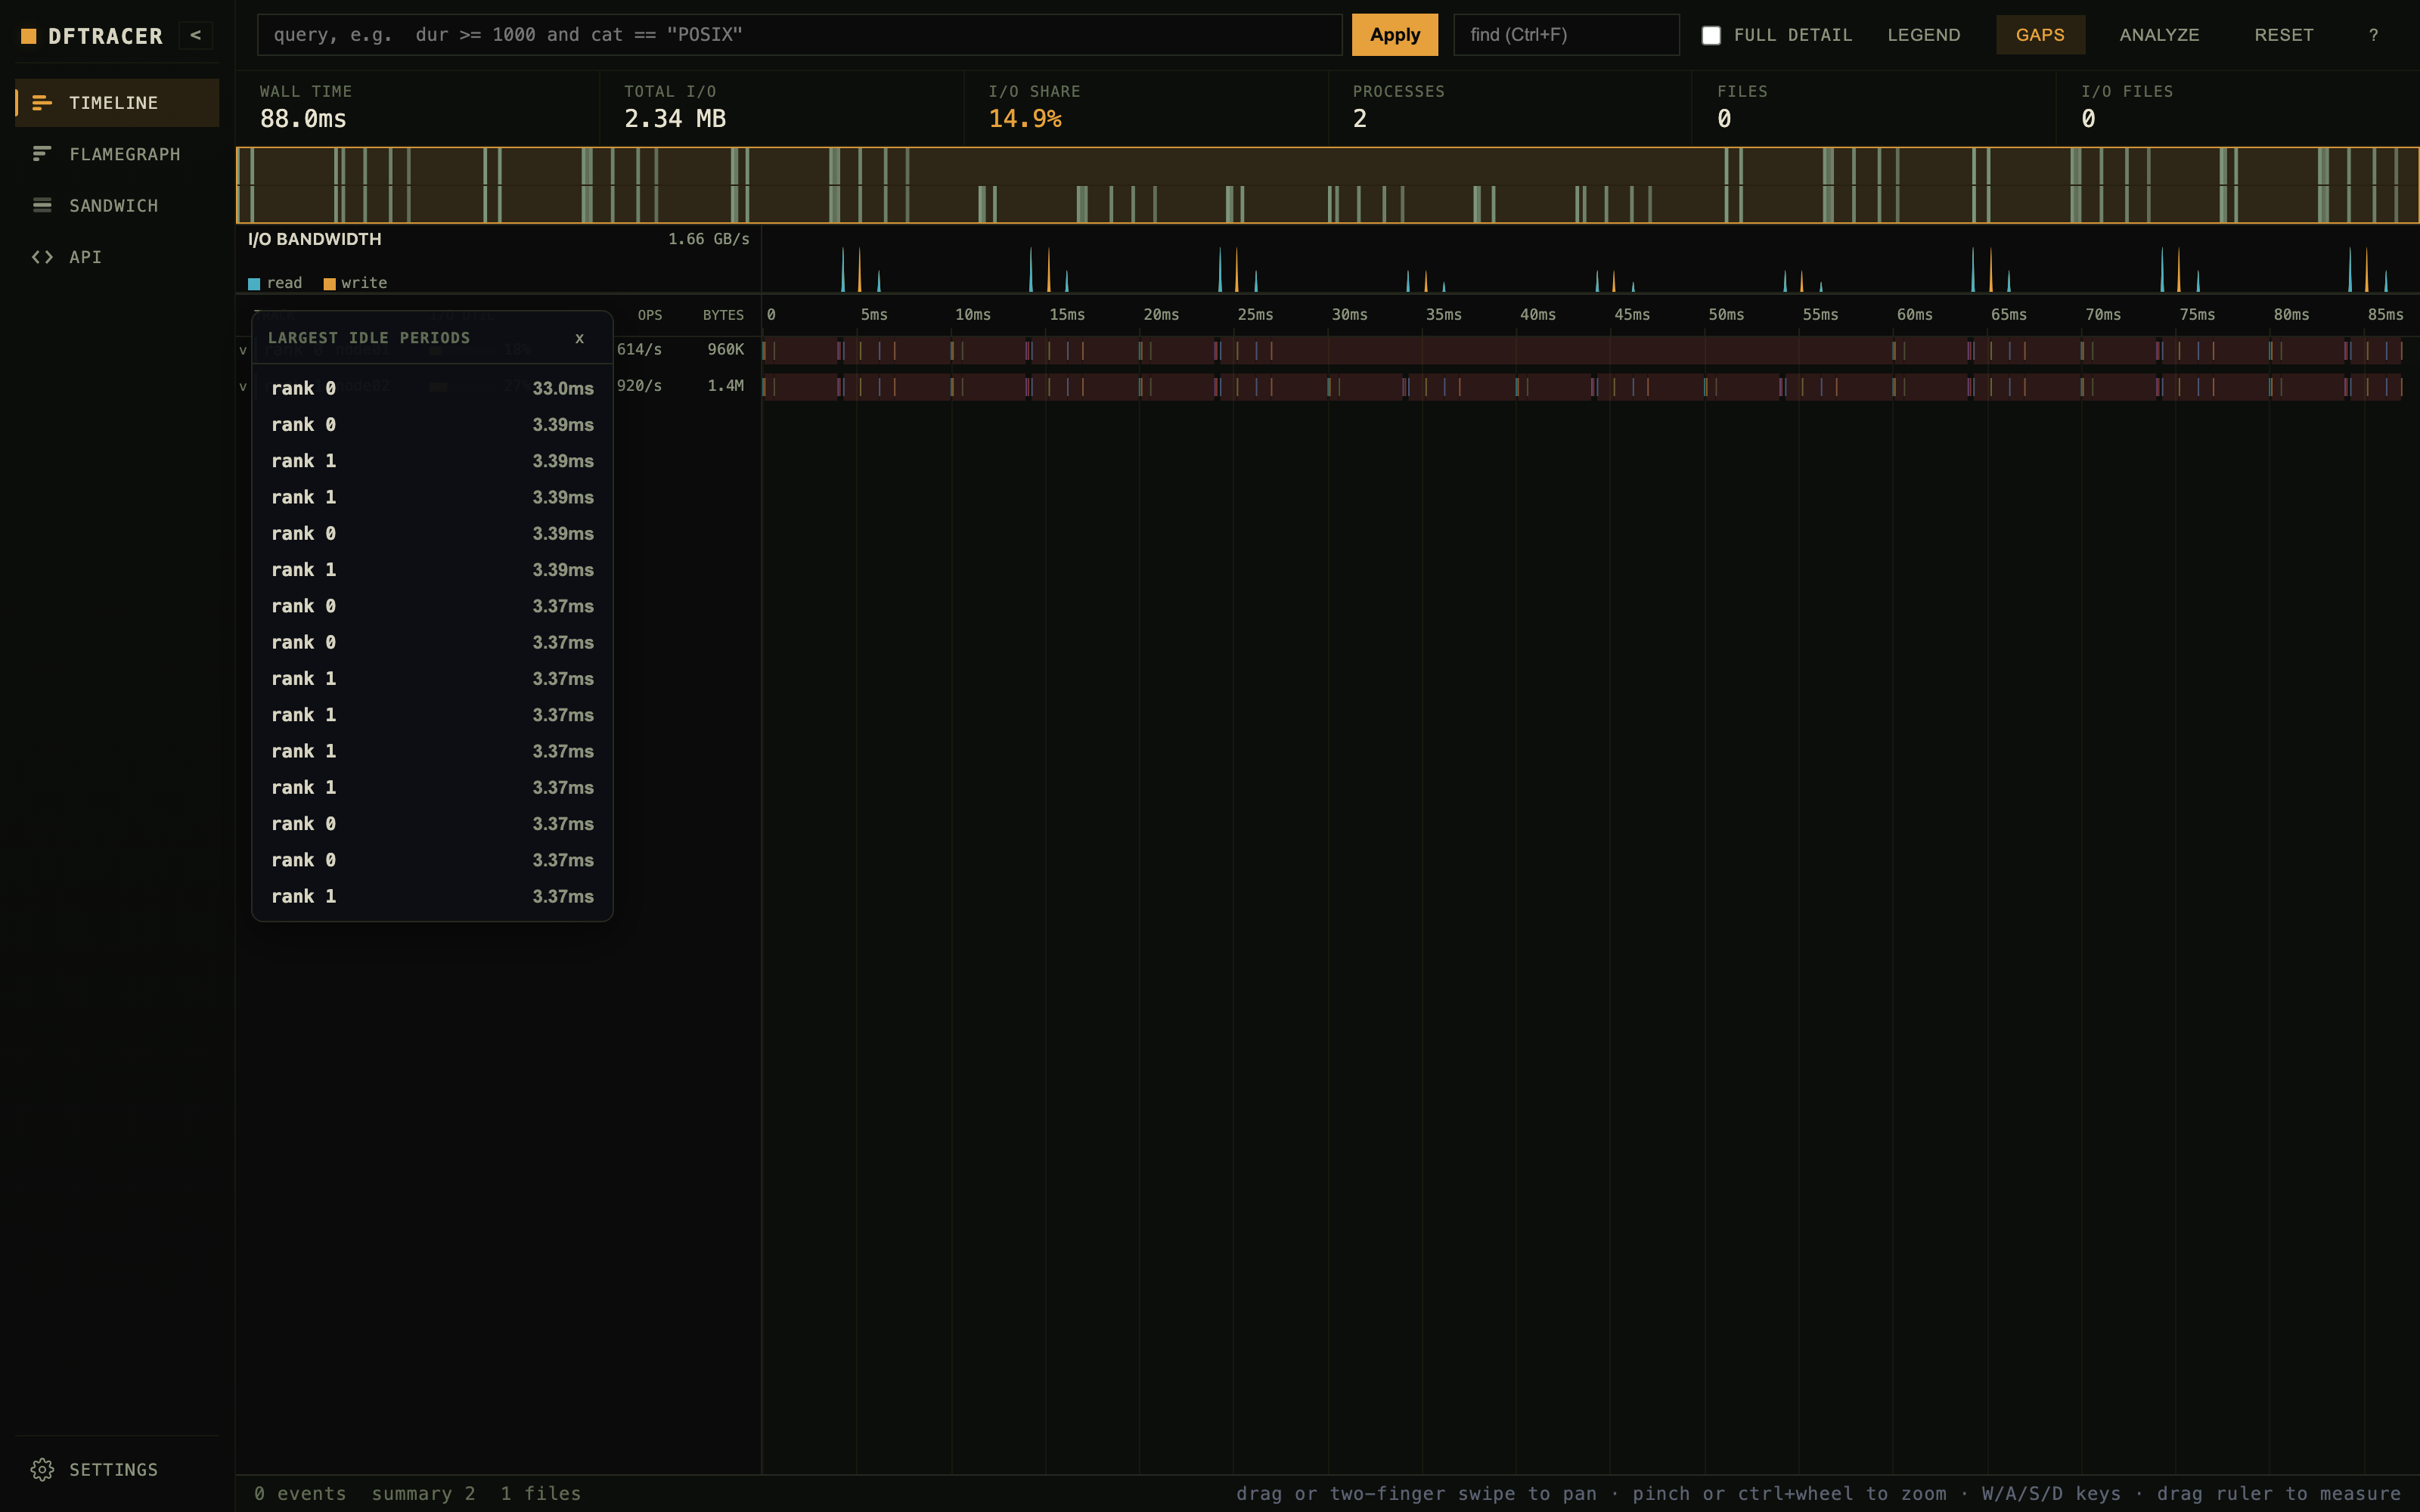
Toggle Gaps to surface the largest idle periods per lane. Idle spans are shaded on the timeline and listed (longest first); click one to zoom to it. Works both zoomed in (from real events) and zoomed out (from the busy fraction of density blocks).
Analyze a range
Drag a time-range selection (or use Analyze) to aggregate the selection server-side by name, file, process, or category, with bottleneck (inclusive time) and bottom-up (self time) breakdowns.
API explorer
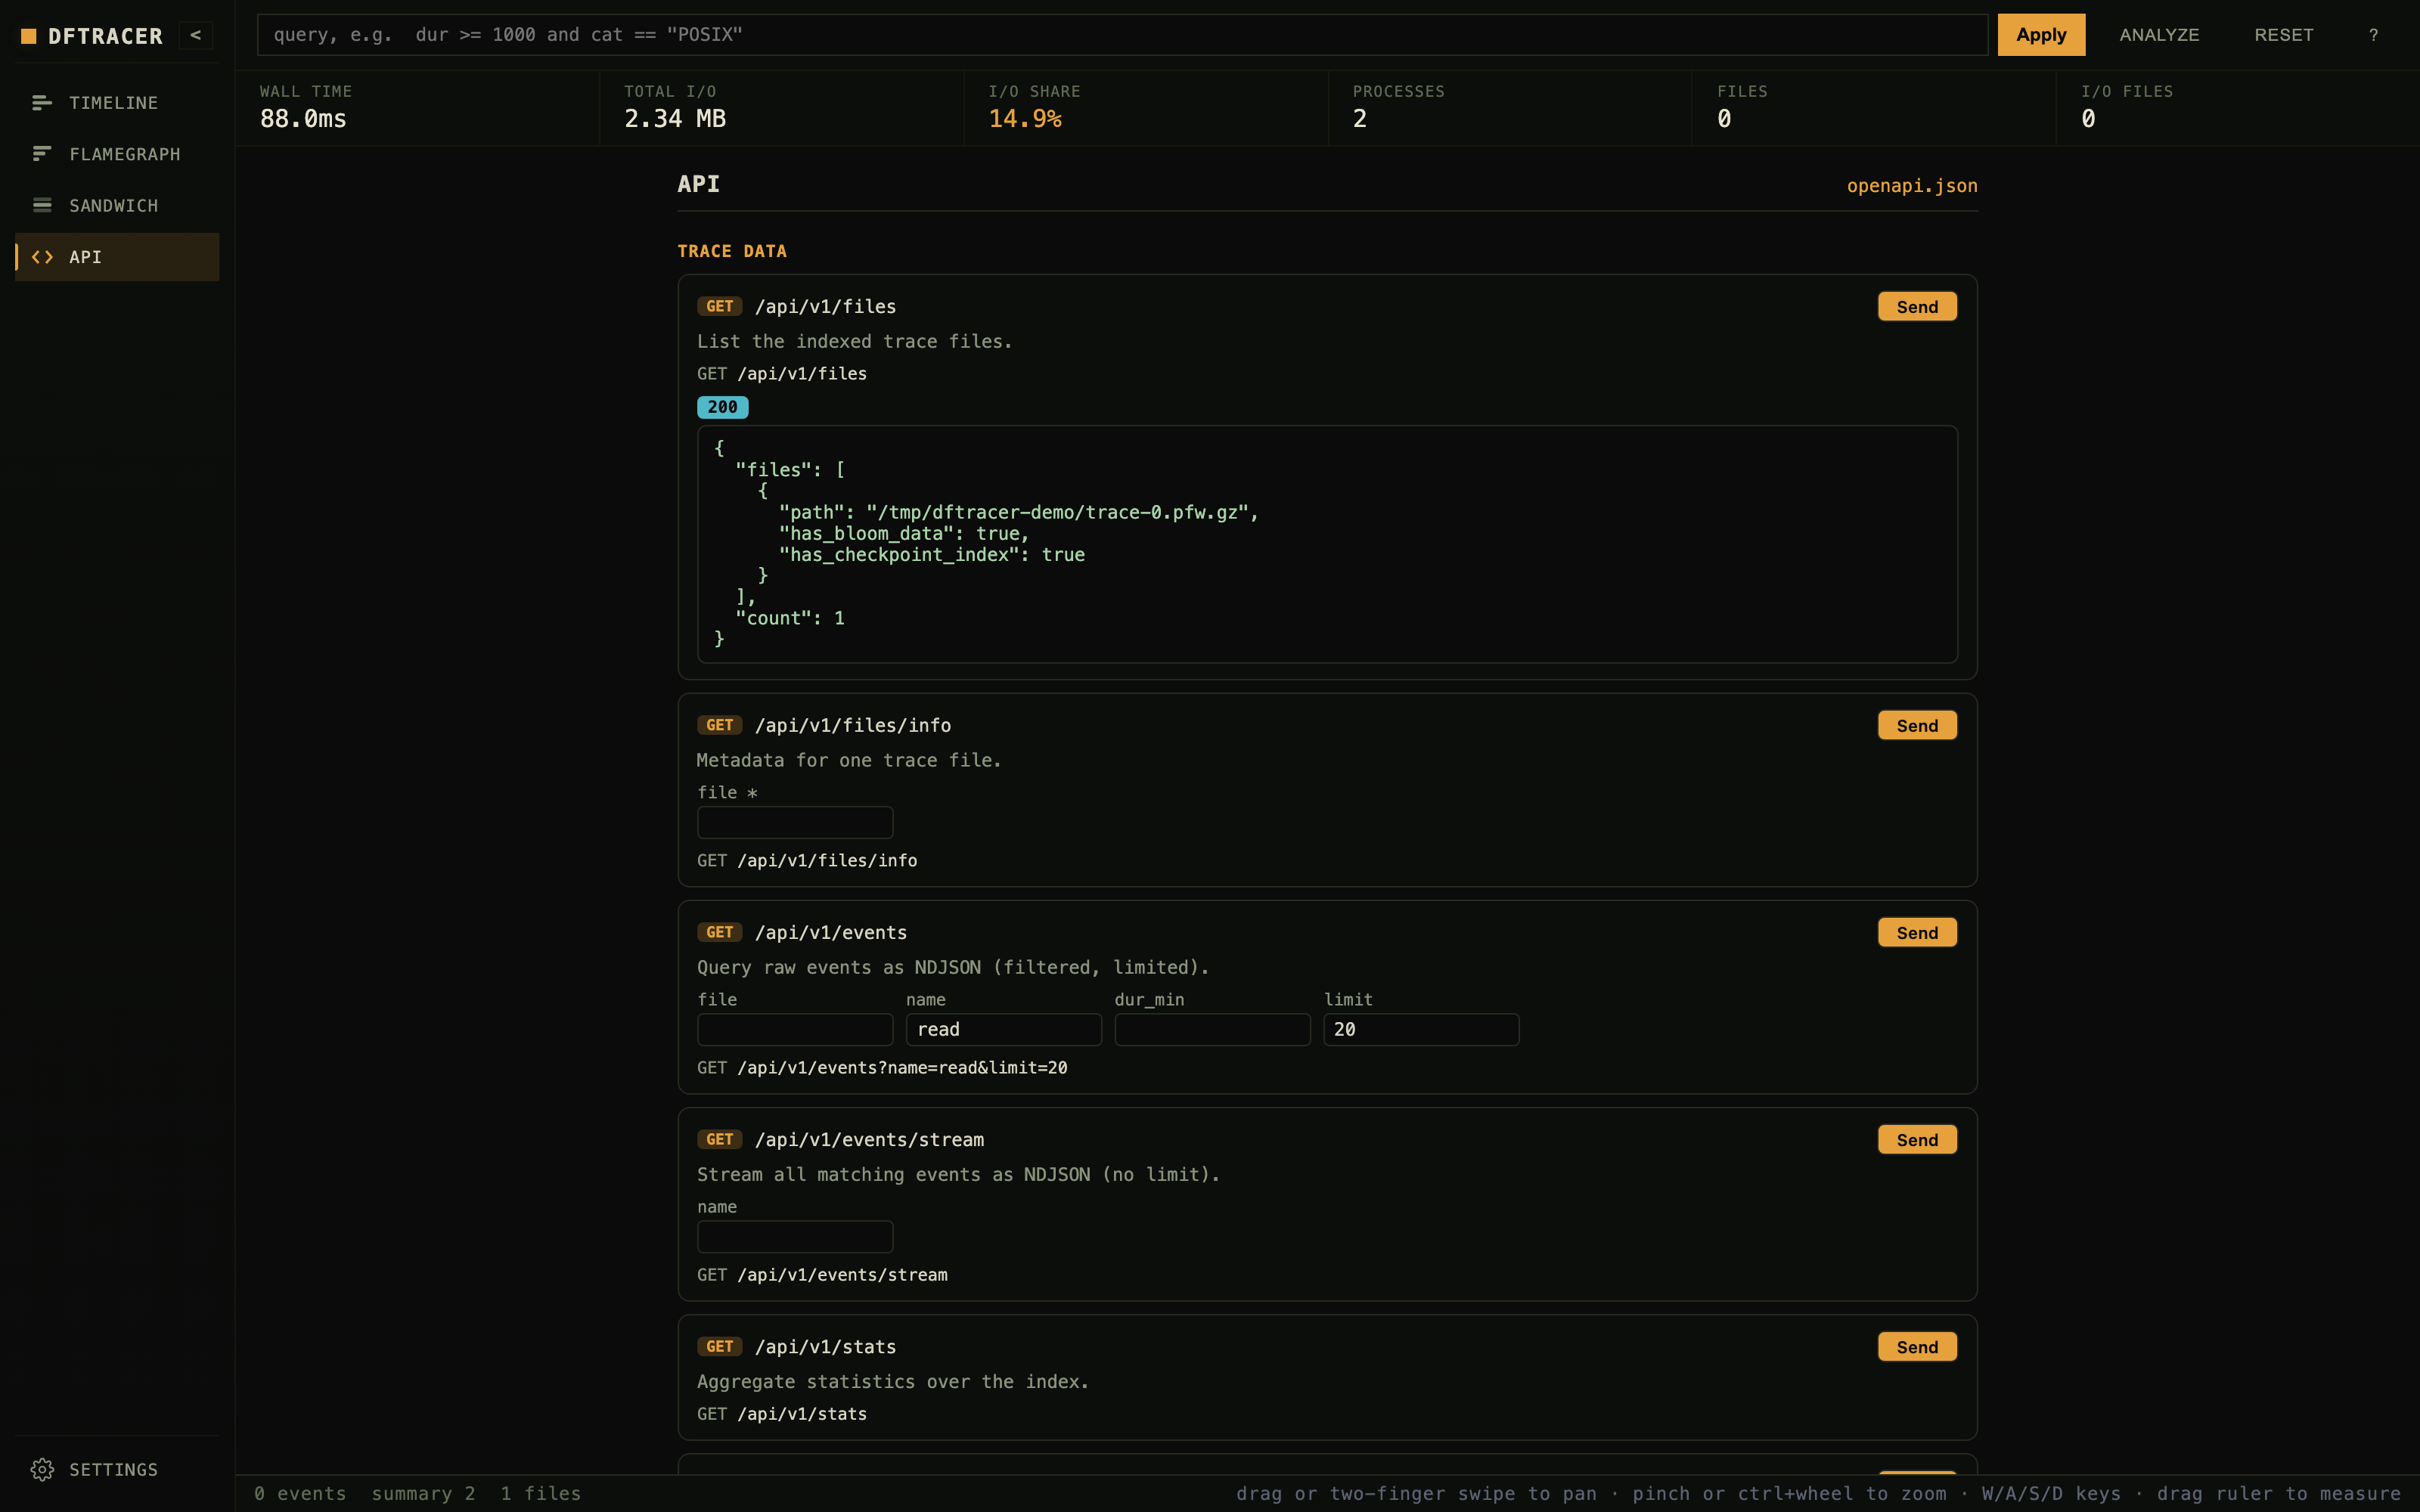
The API view (and the standalone /api page) is an interactive reference
generated from the server’s OpenAPI spec: every endpoint with editable query
knobs, a live request-URL preview, and a Send button that runs the request
against the current server and shows the response. See HTTP Server for the
full REST API reference.
Settings
The gear opens settings: switch between automatic (OS), light, and dark themes (persisted), and, in the VS Code extension, set the server path and load a trace file or directory.