Perfetto UI
This section describes how to use Perfetto UI to visualize dftracer traces.
Loading traces
There are two ways to load traces into Perfetto UI:
Directly in the website
Warning
Use this if your traces are small
Go to Perfetto UI
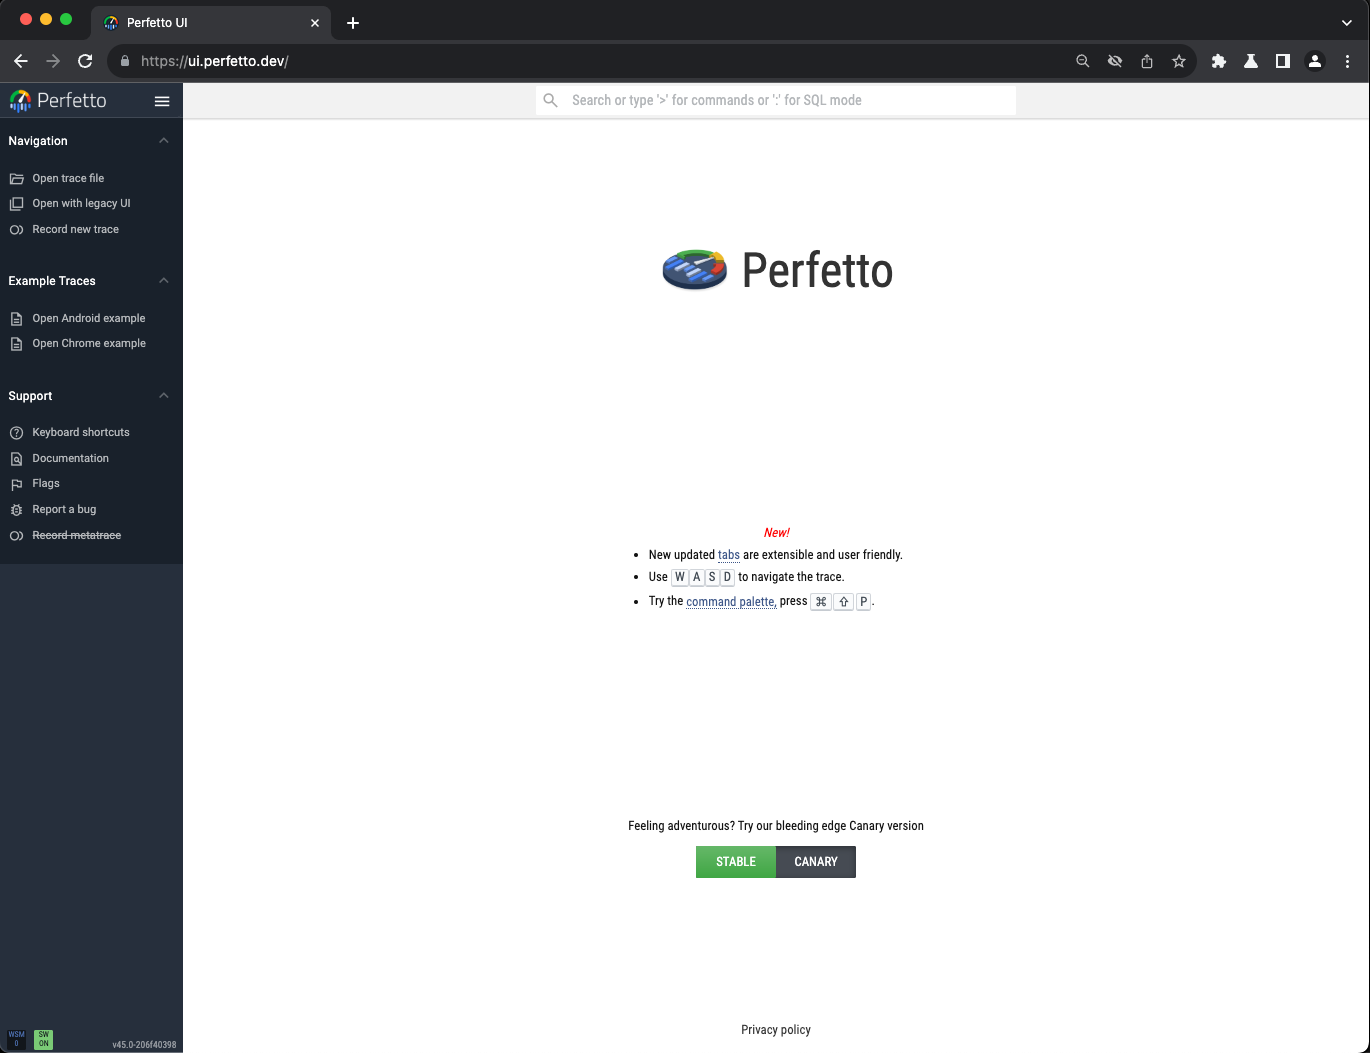
On the top left corner, click Open trace file button and it will ask you to specify the location of the trace file
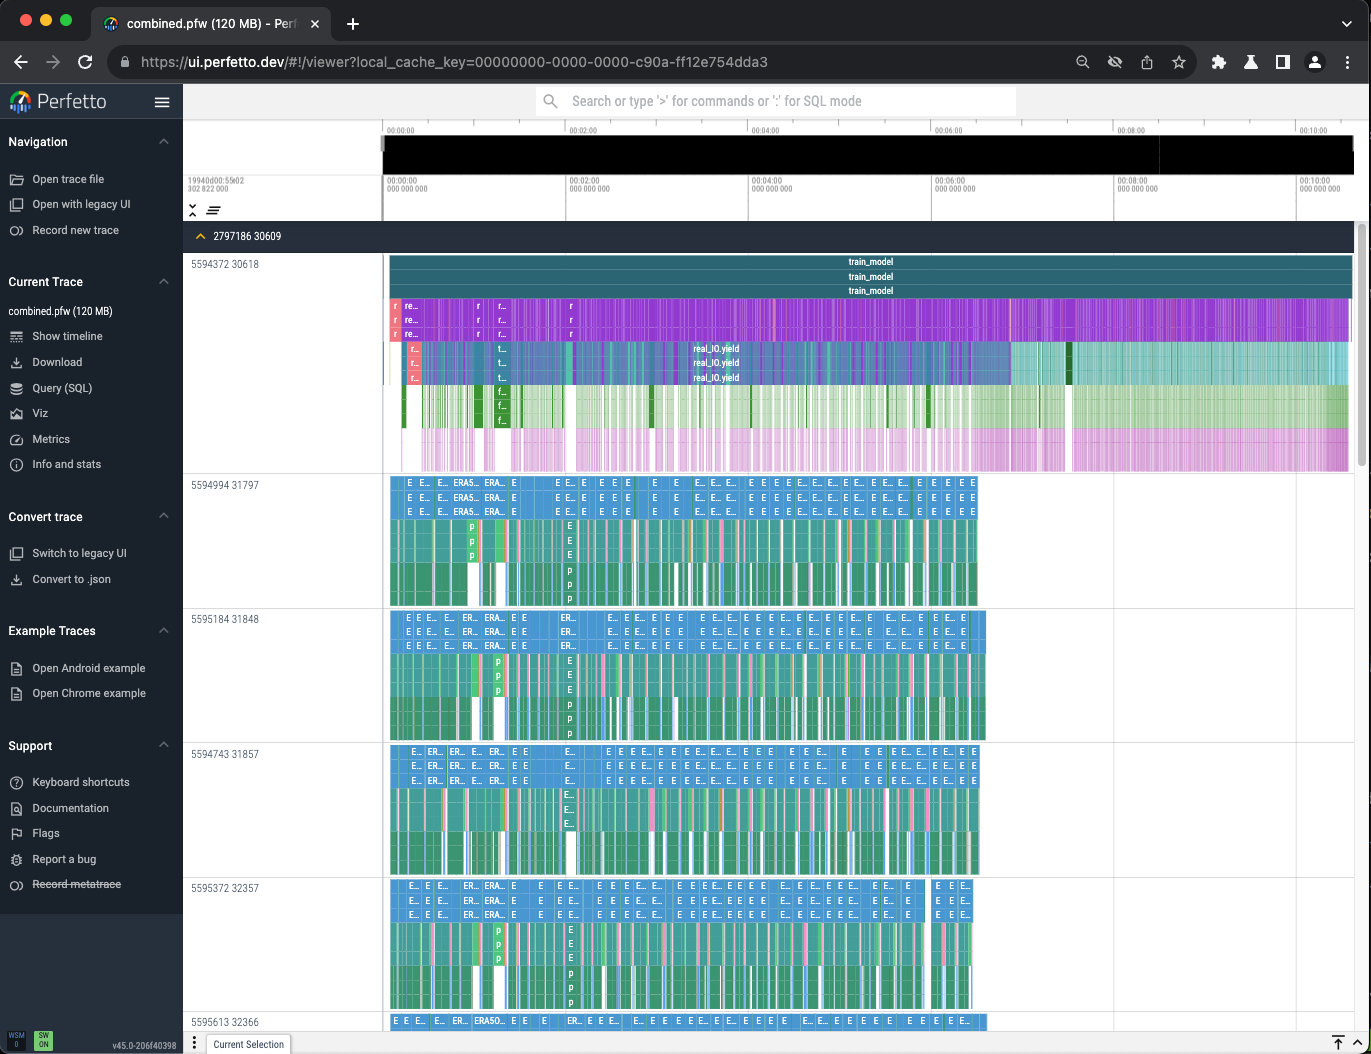
After loading, you can see your trace file now is visualized in Perfetto UI
Using
trace_processorNote
This is a recommeded way to load BIG traces into Perfetto UI. Using this your trace file will be loaded natively rather than in your browser.
Go to Perfetto UI Trace Processor and download the
trace_processorAfter downloading, assuming that it is in the current directory, now you can bridge Perfetto UI with
trace_processorby running the following command:./trace_processor --httpd --http-port <PORT> <trace file>
Then, in your browser, go to
https://ui.perfetto.dev/?rpc_port=<PORT>If the
Perfetto UIask for confirmation below, then click the button Take me to the flags page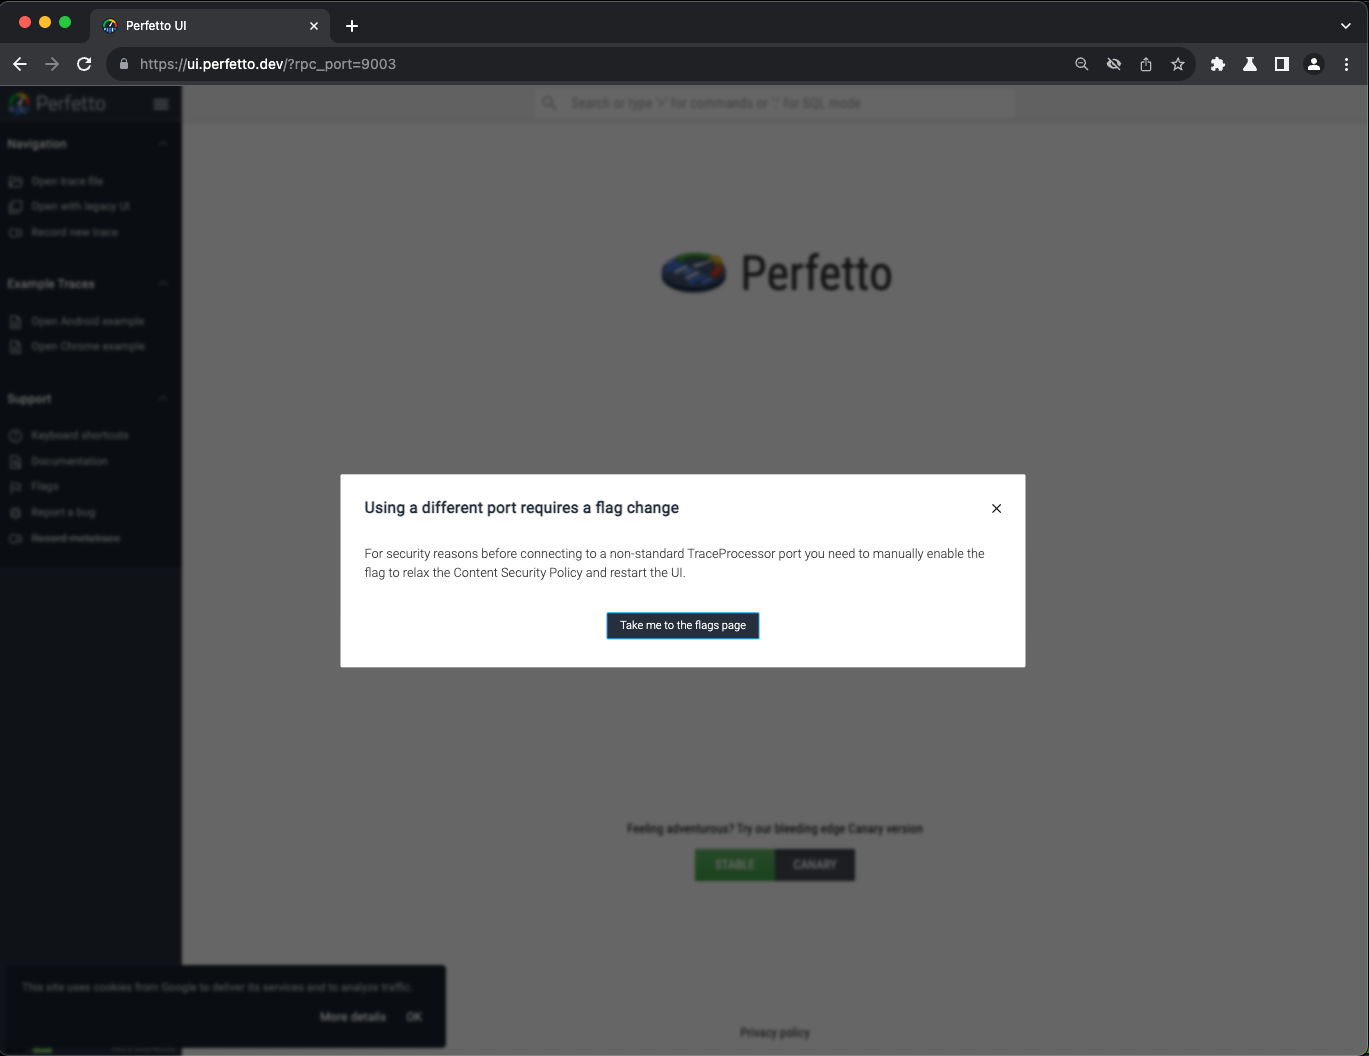
Now, changed this line from disabled to enabled** and reopen
https://ui.perfetto.dev/?rpc_port=<PORT>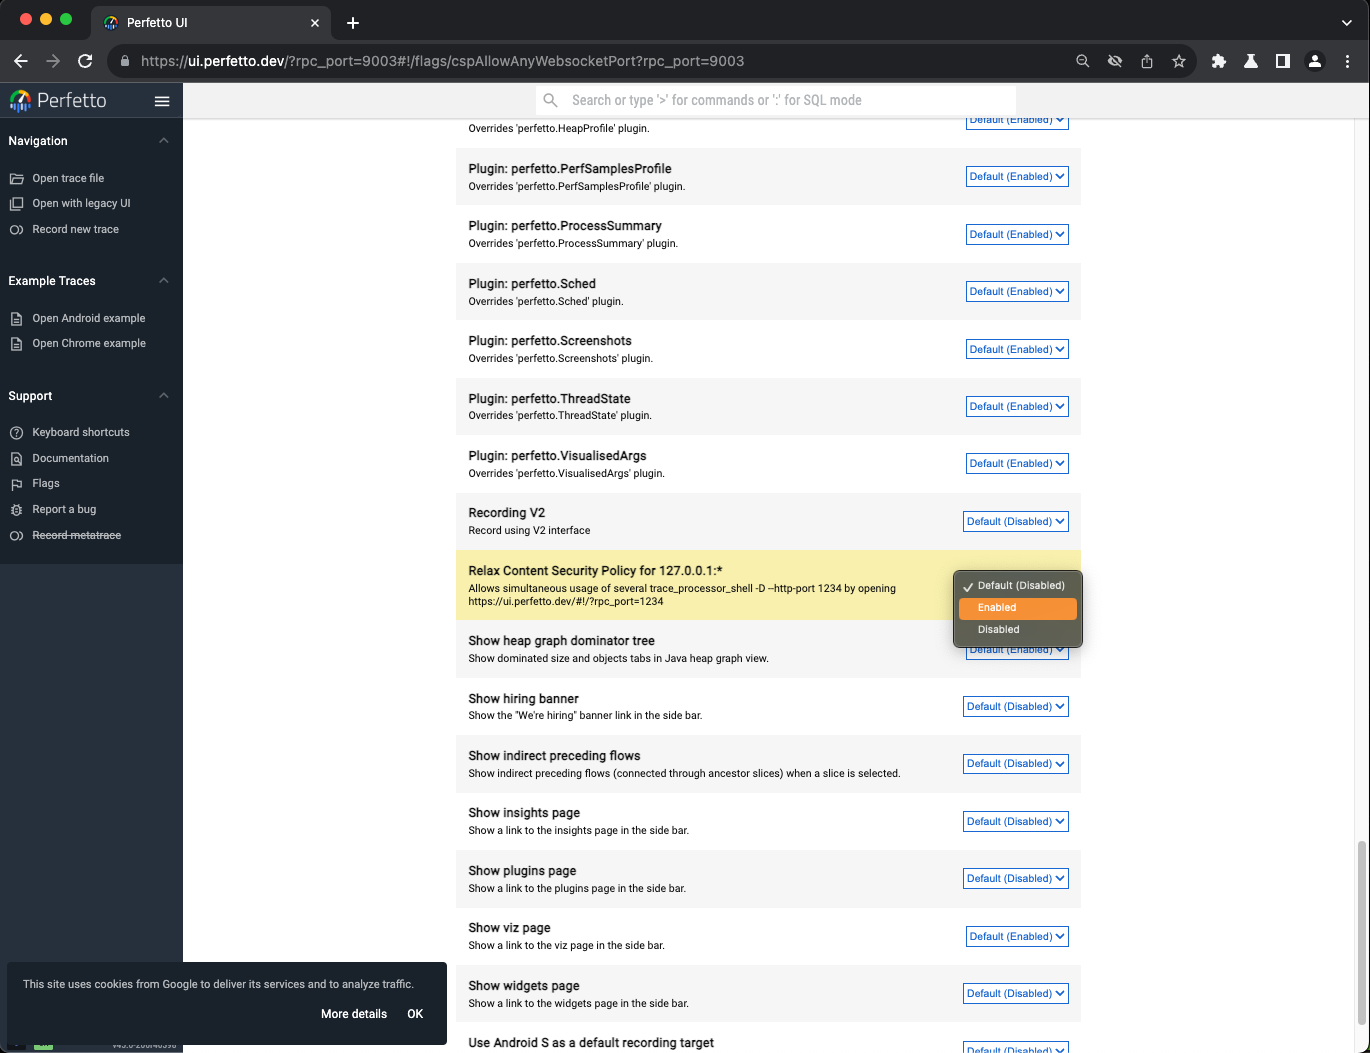
Perfetto UIwill ask for confirmation to choose the UI. For this use case, we just need to choose Use mismatched version regardless (might crash)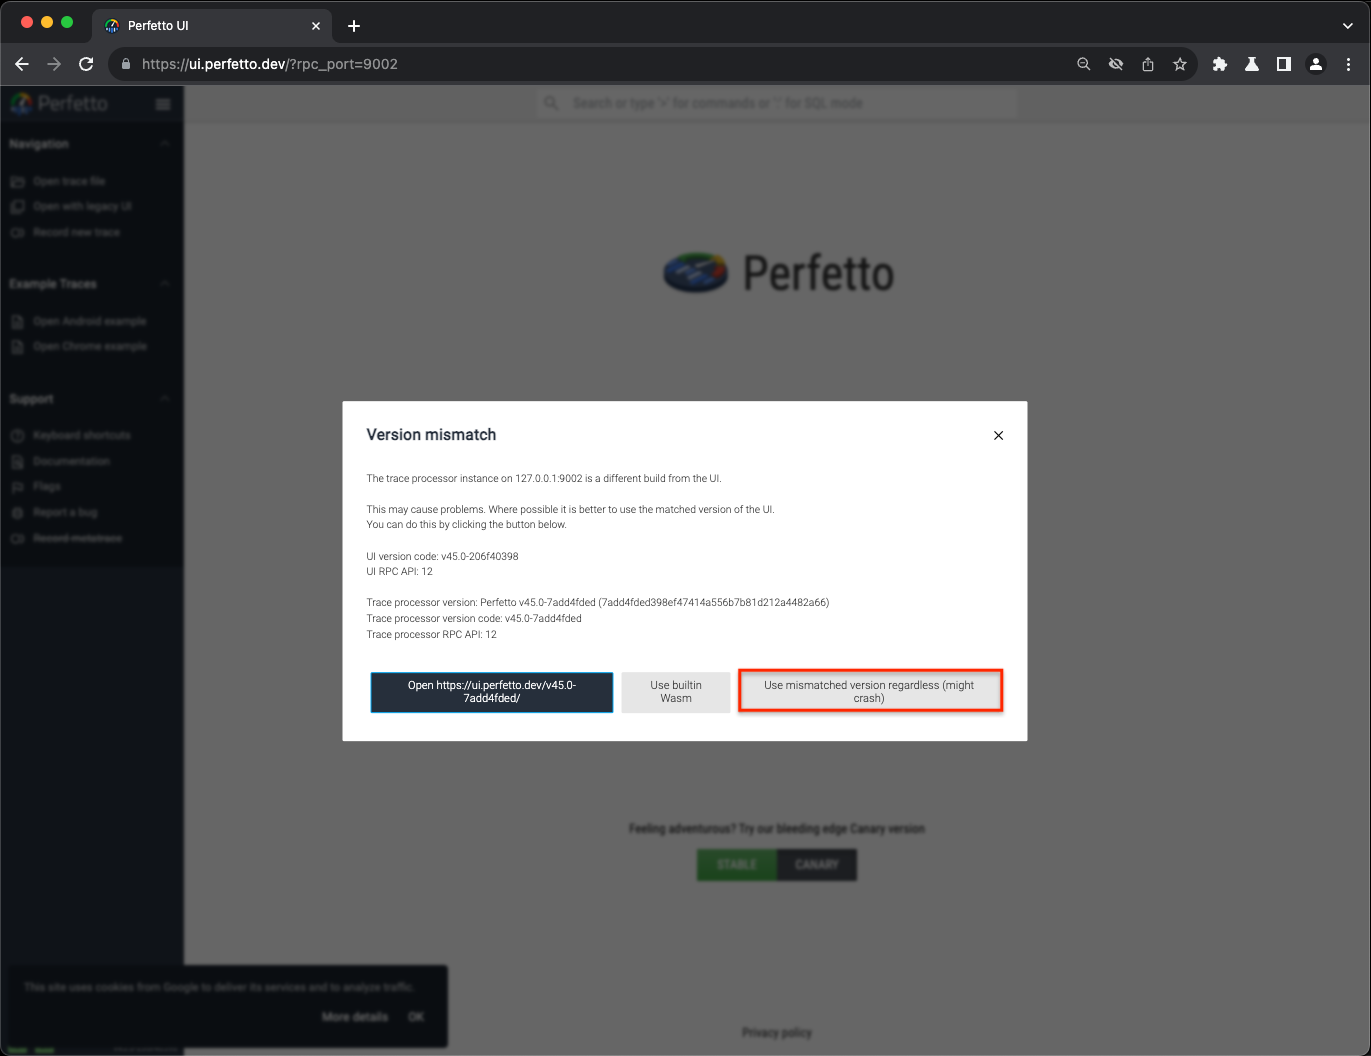
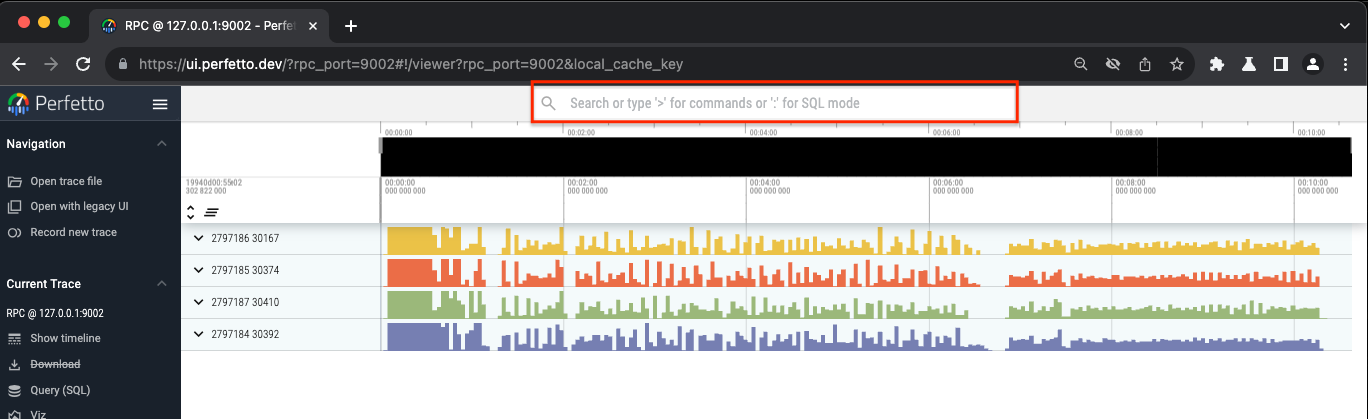
Now, after done, you can see the same visualization as shown above in the first step
Using SQL Query
If you want to do simple trace analysis, fortunately, Perfetto UI provides a SQL query interface.
To do this, click the textbox at the top as shown below
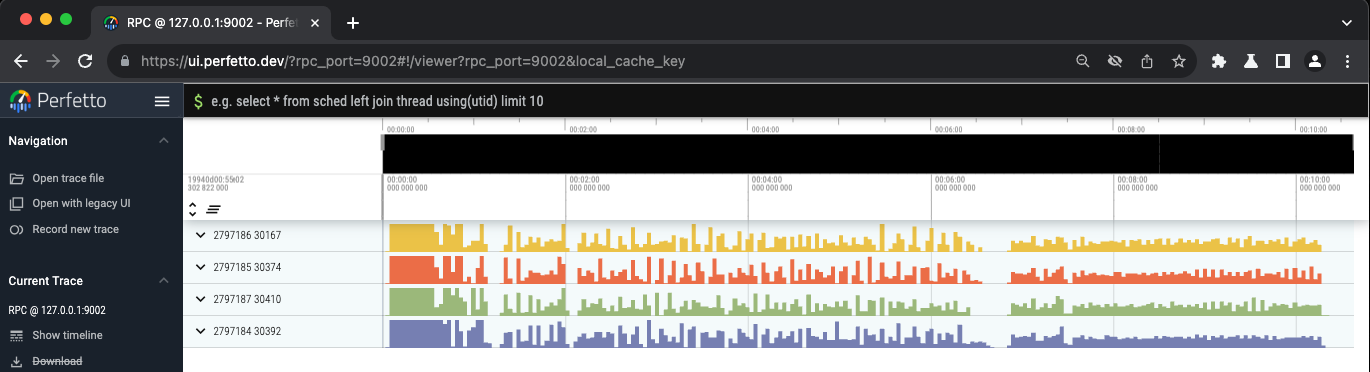
To start typing SQL query, you should type : and then the text box will change into darker color as shown below
Now, we can start typing SQL Query! For the list of tables that can be queried inside Perfetto UI, you can see it in Perfetto Trace Processor Documentation.
Here are some examples that can help you to get started:
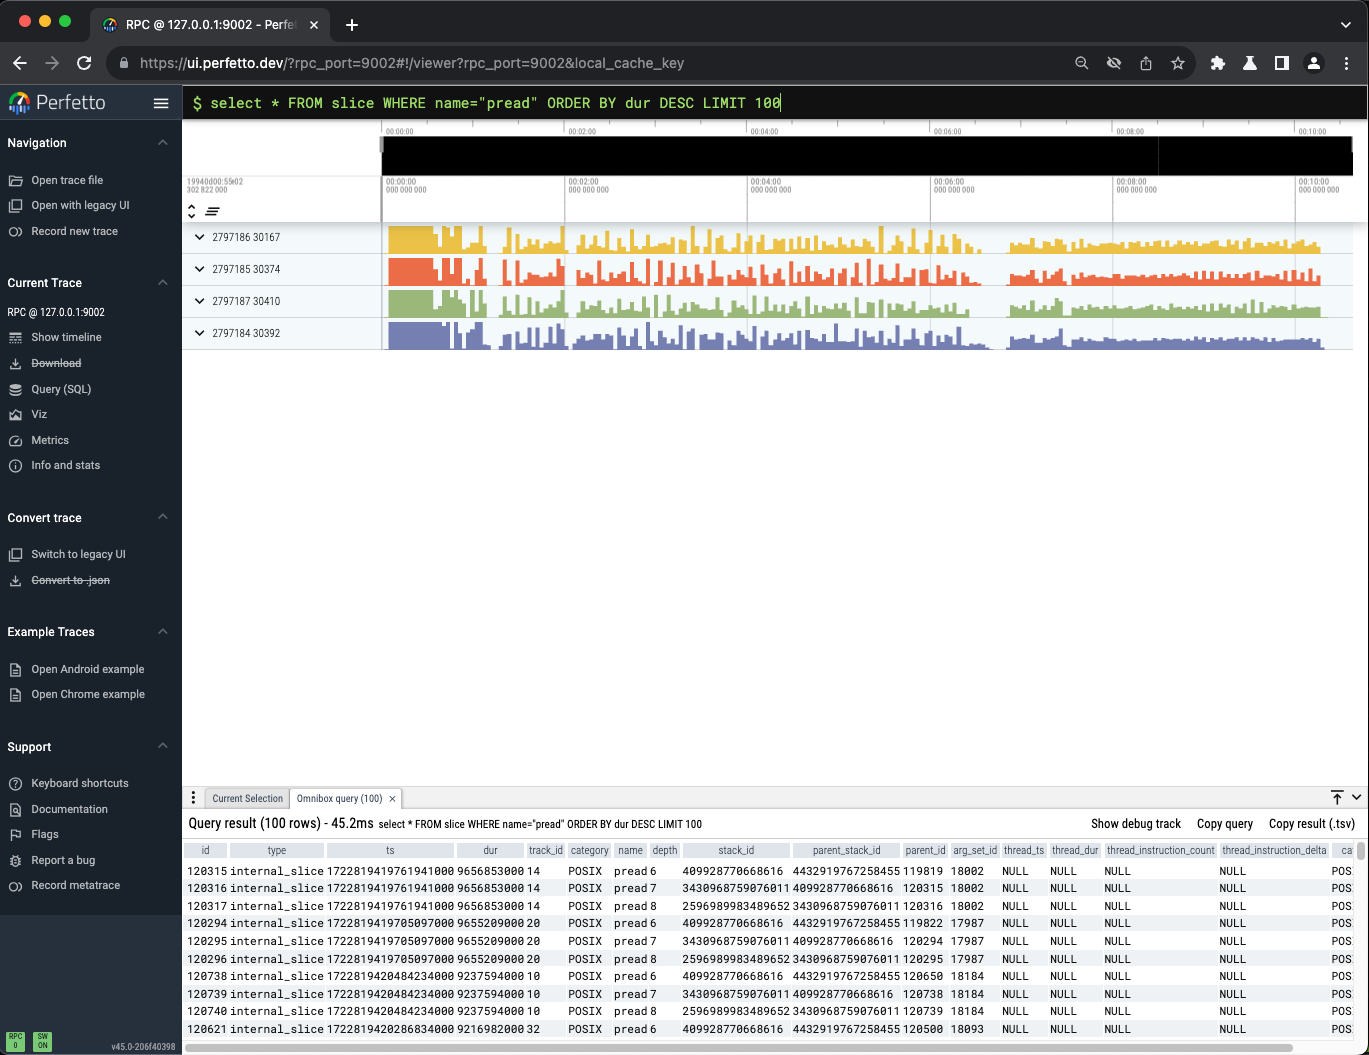
Query pread ordered by duration
select * FROM slice WHERE name="pread" ORDER BY dur DESC LIMIT 100
Query number of __getitem__
select count(*) FROM slice WHERE name LIKE "%__getitem__%"
Find Thread ID of __getitem__
SELECT DISTINCT thread.name as thread_name FROM slice JOIN thread_track ON thread_track.id = slice.track_id JOIN thread using (utid) WHERE slice.name LIKE "%__getitem__%"